Torbjörn Becker investigates the depth of Russia’s oil dependence
Russia’s dependence on oil and other natural resources is well known, but what does it actually mean for policy makers’ ability to control the economic fate of the country? This brief provides a more precise analysis of the depth of Russia’s oil dependence. This is based on a careful statistical analysis of the immediate correlation between international oil prices — that Russia does not control — and Russian GDP, which policy makers would like to control. I then look at how IMF’s forecast errors in oil prices spillover to forecast errors of Russian GDP. These numerical exercises are striking; over the last 25 years oil price changes explain on average two thirds of the variation in Russian GDP growth and in the last 15 years up to 80 percent of the one-year ahead forecast errors. Instead of controlling the economic fate of the country, the best policy makers can hope for is to dampen the short-run impact of oil price shocks. A flexible exchange rate and fiscal reserves are key volatility dampers, but not sufficient to protect long-term growth. The latter will always require serious structural reforms and the question is what needs to happen for policy makers to take action to get control over the long-term fate of the economy.
In a recent working paper (Becker, 2016), I take a careful look at the statistical relationship between Russian GDP and international oil prices. This brief summarizes this analysis and its policy conclusions.
Russia and oil, the basics
Although Russia’s oil dependence is discussed every time international oil prices drop, it is not uncommon to hear that oil is not really so important for the Russian economy. The argument is that the oil and natural resource sector only accounts for some 10 percent of Russian production. This is indeed consistent with the official sectoral breakdown of GDP that is shown in Figure 1 where the minerals sector indeed only has a 10 percent share.
Figure 1. Structure of GDP in 2015
 Source: Federal State Statistics Service, 2016
However, this static picture of production shares does not translate into a dynamic macro economic model that allows us to understand what is driving Russian growth. Instead a careful analysis of the time series of Russian GDP is required to understand how important oil is for growth.
Russian GDP can be measured in many different ways: nominal rubles, real rubles, U.S. dollars, or in purchasing power parity (PPP) terms to mention the most common. Here we focus on GDP measured in real rubles and U.S. dollars since we want to get rid of Russian inflation, which has been quite high for most of the studied time period. The PPP measure generates figures and numerical estimates that are in between the real ruble and U.S. dollar measures and are not included here to conserve space.
The first evidence of the importance of international oil prices as a major determinant of Russian income at the macro level is presented in Figures 2 and 3 where the first figure shows dollar income and the second real ruble income. In both cases it is obvious that there is a strong correlation and that the correlation is higher for income measured in dollars.
Figure 2. U.S. dollar GDP and the oil price
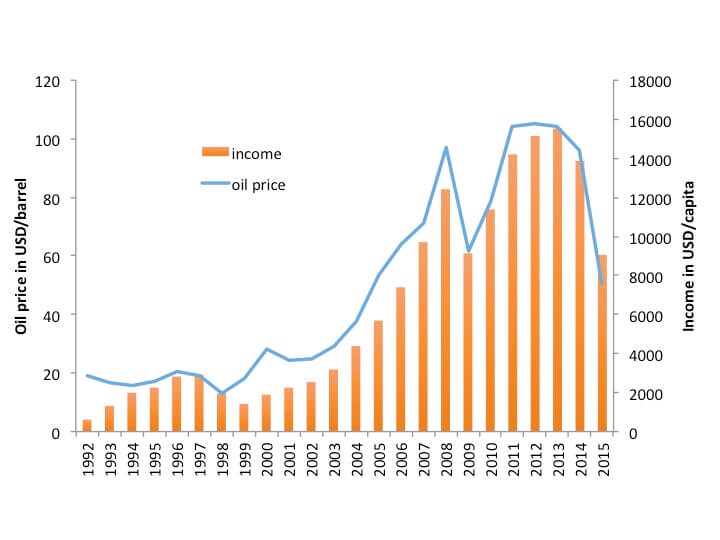 Source: IMF, 2016
Figure 3. Real ruble GDP and the oil price
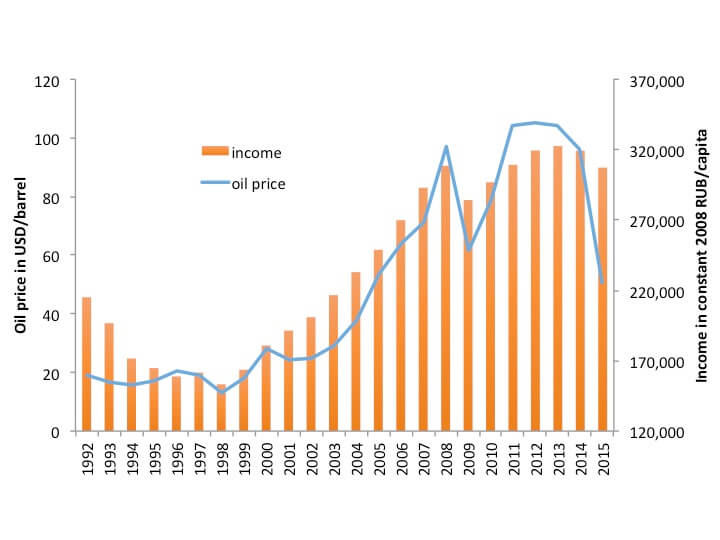 Source: IMF, 2016
However, it is also clear that all the time series have some type of trends or in econometric language, are non-stationary. This means that simple correlations of the time series shown in Figure 2 and 3 may not be statistically valid (or “spurious” as it is called in the literature). This is not a critical issue but can be handled by regular econometric methods.
Russia and oil, the econometrics
When time series are non-stationary they need to be transformed to some stationary form before we can do regular regressions (in Becker, 2016 I also address the issue of using a framework that allows for co-integration).
Two transformations that make the variables stationary are to use first differences or percent growth rates. Both are used before we run simple regressions of growth or first differences of GDP on growth or first difference in international oil prices. The full sample starts in 1993, but since the early years of transition were subject to many different shocks at the same time, a shorter sample starting in 2000 is also used.
A number of observations come from the estimates that are presented in Table 1: Oil prices are always statistically significant; the adjusted R-squared is higher for dollar income than real rubles (with one exception due to a large outlier in 1993); overall the explanatory power of these simple regressions are very high (42-92 percent) and the explanatory power increases in all specifications when going from the full sample (1993-2015) to the more recent sample (2000-2015). Note that the latter sample perfectly overlaps with the current political leadership so contrary to some wishes; the oil dependence has not been reduced under Putin/Medvedev.
Table 1. Russian macro “models”
 Source: Becker 2016
Russia and oil, the forecasts
The strong correlation between international oil prices and Russian GDP provides a very simple econometric model for explaining past variations in Russian GDP. Unfortunately it does not imply that it is easy to forecast Russian GDP since international oil prices are very hard to predict. There are many models that have been used to forecast oil prices, but the IMF and many others now use the market for oil futures to generate its central forecast of oil prices.
The IMF also provides confidence intervals around the central forecast, and the uncertainty surrounding the forecast is substantial: In the latest forecast the 68 percent confidence interval goes from around 20 dollars per barrel to 60 one year ahead, while the 98 percent interval ranges from 10 dollar per barrel to around 85. With oil currently around 45 dollars per barrel, these variations imply that oil prices could either halve or double in the next year, not a very precise prediction to base economic policy on for Russia since the estimates for real ruble growth in the later sample in Table 1 imply that Russian GDP growth in real ruble terms could be anywhere from minus 5 to plus 10 percent, or a fifteen percentage point difference!
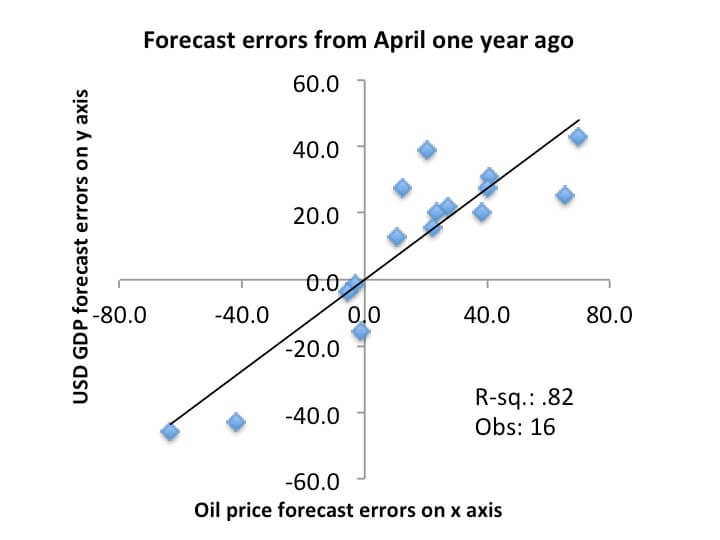
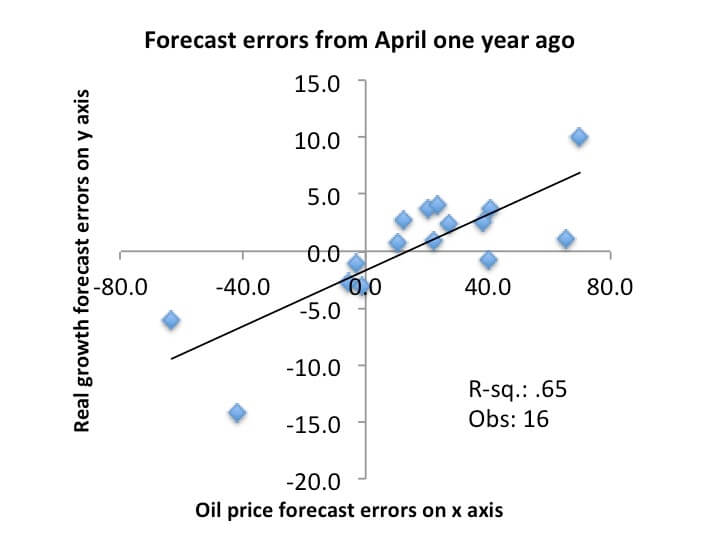
If we look at past IMF forecasts of oil prices and Russian GDP and see how much they deviate from actual values a year later we can compute one year ahead forecast errors. We can do this calculation for the last 16 years for which the IMF data is available. Figures 4 and 5 show how the forecast errors in oil prices correlate with the forecast errors for dollar income and real ruble income, respectively. Similar to the regressions presented in Table 1, the correlations are very high for both measures of GDP: 82 percent for dollar GDP, and 65 percent for real ruble GDP.
In other words, a very large share of the uncertainty surrounding Russian GDP forecasts can be directly attributed to variations in international oil prices, a variable that (again) Russia does not control. The fact that the variations in oil prices explain somewhat more of the variation in dollar income compared to real ruble income is a result of a policy change that in later years allowed the exchange rate to depreciate much more rapidly when oil prices fall.
Figure 4. Forecast errors
 Source: Becker 2016
Figure 5. Forecast errors
 Source: Becker 2016
Policy conclusions
The depth of Russia’s oil dependence is much greater than what casual observers of the mineral sectors share of GDP would suggest. At the macro level, variations in international oil prices explain at least two thirds of actual Russian growth and even more of the one-year ahead forecasts errors.
The experience of the 2008/09 global financial crisis provided an important lesson to Russian policy makers, which is that exchange rate flexibility is required to dampen the real impact of falling oil prices and to protect both international reserves and the fiscal position. In the more recent years, the currency has been allowed to depreciate in tandem with falling oil prices and the drop in real ruble income was therefore less severe in 2015 than in 2009. Income in dollar terms, instead, took a greater hit, but this was a necessary corollary to protecting reserves and the budget. A flexible exchange rate and gradual move to inflation targeting in combination with accumulating fiscal reserves in times of high oil prices are key to Russia’s macro economic stability.
Nevertheless, these policies are not sufficient to remove the long-run impact that low or declining oil prices will have on growth, measured both in real ruble terms or dollar terms. It is nice to have fire insurance when your house burns down, but when you rebuild the house you may want to consider not building another straw house. For Russia to build a strong economy that is not completely hostage to variations in international oil prices, fundamental reforms that encourage the development of alternative, internationally competitive, companies are needed. This includes reforms that initially will reduce policy makers control over the economy and legal system, but over time it will provide the much needed diversification away from exporting oil that puts the fate of the Russian economy squarely in the hands of international oil traders. Losing some control today may provide a lot more control in the future for the country as a whole, but perhaps at the expense of less control for the ruling elite.
References
- Becker, T, 2016, “Russia’s oil dependence and the EU”, SITE Working paper 38, August
- Federal State Statistics Service (or Goskomstat), 2016, data (click here)
- IMF, 2016, World Economic Outlook, April data (click here)
This policy brief is published on Forum for Research on Eastern Europe and Emerging Economies (FREE Network) Policy brief series. FREE Network is a joint initiative by seven research institutes: SITE (Stockholm), BEROC (Minsk), BICEPS (Riga), CEFIR (Moscow), CenEA (Szczecin), ISET (Tbilisi) and KSE (Kiev).
Together, these research institutes form an extensive network of leading academic experts on economic issues in Central and Eastern Europe and the former Soviet Union. For more information please visit the website of FREE Network here.


