Russia’s State Armament Plan of 2010 – The Macro View in mid-2016
Russian defense spending has increased significantly in recent years and reached over 4 percent of GDP in 2015 according to estimates. If the Russian state armament program for 2011-2020 is fulfilled, further large investments will be made in the years to come to modernize the military forces. However, the macro economic realties have change dramatically since the original plans were drawn up in 2010. This brief provides an analysis of what the new macro economic reality means for the armament plans that were made in 2010. In short, the major issue is not that spending as a share of GDP has increased dramatically but rather that the nominal ruble amounts that make up the plan amount to significantly less real purchasing power both in real ruble and dollar terms according to the most recent forecasts. In other words, it is not necessarily the trade off between different government spending areas that will be the main issue in this new macro economic environment, but rather what the priorities will be regarding different types of military equipment within the existing plan.
A 2016 study by Julian Cooper details Russia’s state armament plans for 2011 to 2020, “GPV-2020” (in Russian, State armament program is Gosudarstvennaia Programma Vooruzheniia), to the extent that is possible by using open source information. He makes a special point of discussing the non-transparent structure of Russian defense spending, which makes more precise calculations and statements regarding this expenditure area difficult or even impossible. Nevertheless, he provides broad numbers for the state armament plans that are publically available and this is used in this brief.
The plans of 2010
The state armament plans for 2011-2020 that were made in 2010 were stated in nominal ruble terms. The full path of the plan has not been announced but a total of 19 trillion rubles has been mentioned.
Figure 1. Armament and defense spending
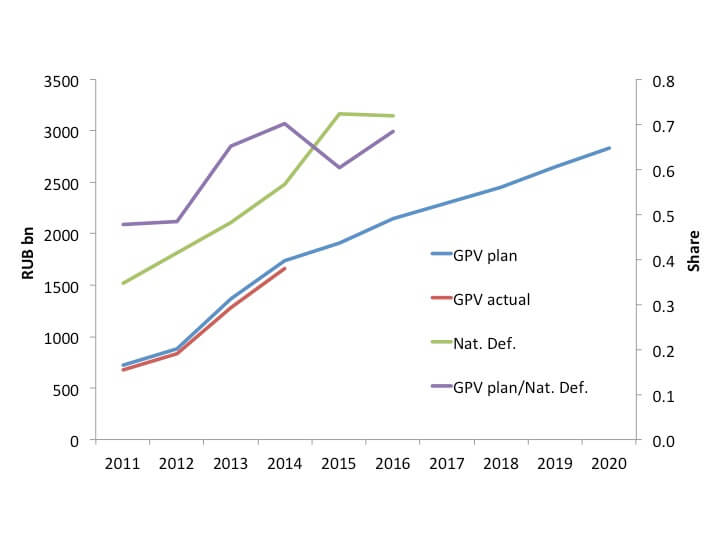 Source: Author’s calculations based on Cooper (2016)
Cooper’s study details amount until 2015 and in Figure 1, the remaining years have been guesstimated by a smooth trend that delivers a cumulative plan of 19 trillion rubles.
The armament plans were very ambitious and it is noteworthy that they were almost fully implemented during the years for which we have actual numbers from Cooper’s study (the blue and red lines almost overlap perfectly). The other rather remarkable feature is how high these spending are compared to the national defense spending reported in his report, with the GPV plan peaking at 70 percent of defense spending.
Changing macro environment
The armament plans were not made in a vacuum but decided based on the economic outlook at the time, i.e., what policy makers projected in 2010.
Figure 2. IMF forecasts and actual GDP
 Source: Author’s calculations based on IMF (2010, 2016). Note: The IMF’s 2010 forecast only goes to 2015 and for the remaining years a constant growth rate based on the last year is used.
Figure 2 shows what the IMF’s growth forecasts back in 2010 implied for the development of nominal GDP (dotted blue line); what actually happened until 2015 (solid red line); and what is projected to happen between 2016 and 2020 according to the latest IMF World Economic Outlook forecast of April 2016 (dotted red line). As is pointed out in Becker (2016), international oil prices are key for Russia’s growth performance and any forecast of it is no better than the forecast of oil prices. This implies that also the IMF’s April 2016 projection is highly uncertain, but this is true for any other forecast of Russian GDP as well.
There are two important observations that follow from Figure 2; first, nominal GDP at the start of the program was underestimated; and second, the growth rate was overestimated. As coincidence some times has it, two wrongs make close to a right for 2016; i.e., the forecast of 2010 almost perfectly coincides with what is expected to be the nominal GDP level in 2016 and 2017 in the latest IMF forecast. However, since the slowdown in expected growth is rather significant, in later years the IMF now expects nominal GDP to be less than what it thought it would be in 2010.
Implications for the GPV
The fact that nominal GDP in 2016 and 2017 is almost exactly the same as projected in 2010 implies that the GPV plan as a share of GDP based on the 2010 forecast compared with the 2016 forecast is almost the same in 2016 and 2017. This may be viewed as a peculiar circumstance but it can also have real implications. If the plan in 2010 was developed with a greater view of priorities in different government spending areas, the fact that the plan is still not absorbing more as a share of GDP suggest that the plan may not necessarily be a contentious issue at the level of the government.
However, this is expected to change after 2017 when nominal GDP will be lower than originally thought, and therefore the GPV share of GDP would be higher as seen in Figure 3.
Figure 3. GPV plan as share of GDP
 Source: Author’s calculations based on Cooper (2016) and IMF (2010, 2016)
A more immediate concern would be what the nominal spending plan from 2010 actually buys in real terms in 2016. This is a more fundamental issue than changes in nominal GDP that will affect how quickly the armed forces can modernize their equipment. Figure 4 compares how the real purchasing power of the plan has changed from the 2010 to the 2016 forecasts, both in terms of constant (or real) ruble terms (green and purple lines) and in nominal U.S. dollar terms (red and blue lines).
Figure 4. The real spending power of GPV
 Source: Author’s calculations based on Cooper (2016) and IMF (2010, 2016)
It is clear that there has been a significant reduction in real purchasing power both in real ruble and dollar terms. The cumulative change in real ruble terms is a loss of 12 percent in purchasing power, while the loss in dollar terms is 45 percent. Since most of the loss in spending powers is from 2014 forward, the impact in the remaining years is even higher than what these cumulative numbers indicate.
The actual impact on the spending plan will crucially depend on how much of what is planned needs to be imported but it is nevertheless clear that there has been a significant reduction in purchasing power if the initial plan in nominal ruble is implemented. This is without any consideration of the impact of sanctions or reallocating government resources to other spending areas that may be considered and would affect this calculation.
Policy conclusions
Although the precision of the discussion in this brief is no better than the accuracy of the available numbers, the general trends and qualitative conclusions made here are most likely still relevant. And without any claim of being able to assess the quality of military equipment or the ability Russia’s military industrial complex to make the right priorities (see instead Rosefielde, 2016 for such discussion), it is clear from a pure economics standpoint that the changing macro environment will have serious real implications for how quickly the modernization process of equipment can go.
It is also highly likely that the worsening of the economic outlook in 2016 compared with 2010 will lead to more general discussions of government spending priorities. Spending on producing arms by the military industrial complex could in principle be a Keynesian type of demand injection that can raise growth in the short run if there are idle resources that are put to use and generate income to workers that in turn spend more of consumption. However, it is not likely that the resources required to build sophisticated new military equipment is idle even in an economic downturn, so this effect is likely not very significant. Instead, more spending in areas that are already in short supply will generate inflation or put pressure on the exchange rate depending on how much is produced domestically and how much is imported of the demanded goods and services.
Long-term growth can also be affected if the GPV plan crowd out resources from other spending areas. The effect will of course depend on what the spending alternatives are and how this is linked to future growth; if military spending does not generate growth by itself while reducing spending on education, research and health care that we think promote long-term growth, prioritizing military spending will have an additional price in terms of reduced future growth. There could be cases where spillovers from military production are significant and spur new businesses and thus generate economic growth, but this does not seem to have been the case in the past in Russia.
In short, it will be hard for policy makers to avoid making tough decisions on what spending areas to prioritize given the new macro outlook for Russia. And even if the spending in nominal rubles in the GPV-2020 plan does not change, there will be new trade-offs to be made within the plan given how higher inflation and a depreciated currency has reduced the purchasing power of the original 2010 plan.
References
- Becker, T, 2016, “Russia’s oil dependence and the EU”, SITE Working paper 38, August.
- Rosefielde, S., 2016, “Russia’s Military Industrial Resurgence: Evidence and Potential”, Paper prepared for the conference on The Russian Military in Contemporary Perspective Organized by the American Foreign Policy Council, Washington DC, May 9-10, 2016.
- Cooper, J., 2016, “Russia’s state armament programme to 2020: a quantitative assessment of implementation 2011-2015”, FOI report, FOI-R-4239-SE.
- IMF, 2010, World Economic Outlook, October 2010 data, http://www.imf.org/external/pubs/ft/weo/2010/02/weodata/index.aspx
- IMF, 2016, World Economic Outlook, April 2016 data, http://www.imf.org/external/pubs/ft/weo/2016/01/weodata/index.aspx
This policy brief is published on Forum for Research on Eastern Europe and Emerging Economies (FREE Network) Policy brief series. FREE Network is a joint initiative by seven think tanks: SITE (Stockholm), BEROC (Minsk), BICEPS (Riga), CEFIR (Moscow), CenEA (Szczecin), ISET (Tbilisi) and KSE (Kiev). Together, these research institutes form an extensive network of leading academic experts on economic issues in Central and Eastern Europe and the former Soviet Union. For more information please visit the website of FREE Network here.