What are the effects of banning Russian oil and gas across the EU?

The EU Import Bill and Russian Energy Sanctions
While the effects of such a ban will go beyond a direct increase in the import costs of oil and gas, our estimates provide a useful reference point in discussing the impact of such sanctions on the EU. Our estimates suggest that the relative increase in the import costs in the case of an oil embargo would be more evenly spread across the Member States, than in the case of a natural gas ban. This parity makes an EU-wide Russian oil embargo a more straightforward sanction policy. In turn, a full replacement of Russian gas imports across the EU – due to either a gas embargo or retaliation from Russia in response to an oil ban – is likely to require some kind of solidarity mechanism.
Introduction
Since the beginning of the Russian invasion of Ukraine, the West has been discussing the idea of sanctioning the aggressor by banning Russian energy imports. The motivation is quite straightforward. In 2021, Russian oil and gas exports constituted 49% of Russian goods exports or 14 % of Russian GDP, and the Western world (in particular, the European Union) is the main recipient of these exports. Banning Russian oil and gas export would, thus, lead to heavy pressure on the Russian economy.
The discussion has been quite heated. The US actually implemented a ban on Russian oil and gas in early March 2022, but this gesture has been largely seen as relatively symbolic, as the US dependency on Russian energy imports is quite limited. EU politicians have voiced different opinions about the feasibility of Russian energy sanctions. While some advocate an immediate ban, others argue for a more gradual decrease in imports or even for continuing imports effectively in a business-as-usual fashion. While the EC has announced plans to cut down the consumption of Russian gas by two-thirds in 2022 and mentioned the implementation of “some form of oil embargo” as part of their 6th sanction package, there is still no consensus across the EU. Sanctions on Russian oil and gas imports have not been implemented in the EU by the time of writing this brief.
The main reason for this hesitation is the extent to which Russia remains the main energy supplier. In 2020, 39% of gas and 36% of oil and oil products in the EU were imported from Russia, and the feasibility and consequences of replacing these with alternative supplies are debatable. Since the beginning of the war academics, international organizations and consultancies have offered a variety of analytical materials on the feasibility and implications of such energy sanctions (see e.g., Bachmann et al. 2022. Chepeliev et al, 2022, Fulwood et al., 2022, Guriev and Itskhoki, 2022, Hilgenstock and Ribakova, 2022, IEA, 2022, RYSTAD 2002a,b, Stehn, 2022 to name just a few).
This brief contributes to these estimates by discussing how a Russian oil and gas ban could affect the energy import bill across individual EU countries. We start by providing details on the EU’s dependency on Russian oil and gas imports. We then proceed to access the scope of the costs that a ban on Russian energy could imply for the EU energy sector. We conclude with a discussion about the feasibility of political agreement on such sanctions.
Import Dependency and Dependency on Russian Energy Across the EU
The two primary channels through which a Russian energy ban would affect the vulnerability of an EU country are the dependency on Russian oil and gas, and the overall energy import dependency. The former matters since a ban would imply an immediate necessity to replace missing volumes of energy. This would lead to an increase in energy prices widely across markets, thereby signifying the importance of the latter channel, the overall import dependency.
Figures 1 and 2 depict the dependency on Russian oil and gas across the EU member states. In Figure 1, the dependency is measured as a ratio of Russian energy imports to the gross available energy for each energy type separately – crude oil, oil and oil products, and natural gas. However, this measure may not reflect the importance of the respective energy type in a country’s energy portfolio. For example, in Finland, Russian gas imports constitute 67% of gross available natural gas. However, natural gas is less than 7% of the country’s energy mix, thus the overall effect of Russian gas on the Finnish energy sector and economy is rather limited. To account for this, Figure 2 offers an overview of the contribution of Russian energy imports to the cumulative energy portfolio across the EU.
Both figures show that there is a large variation both in terms of the contribution of individual energy types and in terms of overall dependency on Russian fuels. For example, the latter is almost negligible for Cyprus and well over 50% for Lithuania (however, Figure 2 accounts for re-exports and, thus, overestimates the role of Russian energy imports for Lithuanian domestic available energy in 2020.
Figure 1. Share of Russian energy imports in gross available energy, by fuel, 2020.
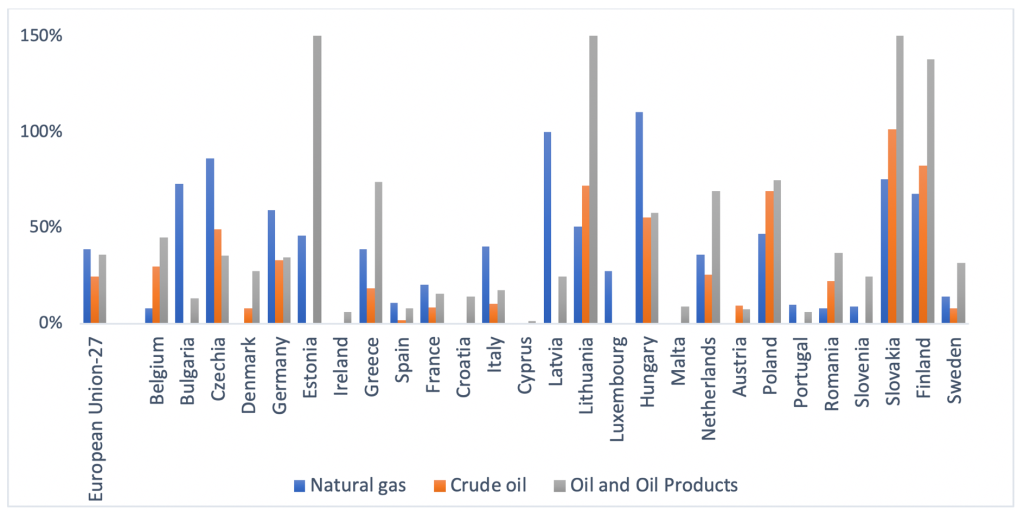
Note: Gross available energy indicates the overall available energy supply on the territory of the country. It is defined as Gross available energy = Primary production + Recovered and recycled products + Imports – Exports + Change in stock. . In several EU member states natural gas transit may be included in the imports. As a result, the high share of Russian energy may reflect not only imports for consumption but also for transit, as well as fuels for refinement and further export (e.g. oil products in Estonia (cut at Figure 1, 285%), Lithuania (cut at Figure 1, 201%), Slovakia and Finland). Austrian data on natural gas imports from Russia are confidential and not represented in the diagram. Denmark and Croatia did not report Russian gas imports data for 2020 to Eurostat. Source: Eurostat.
Figure 2. Share of Russian energy imports in total gross available energy, 2020. Source: Eurostat.
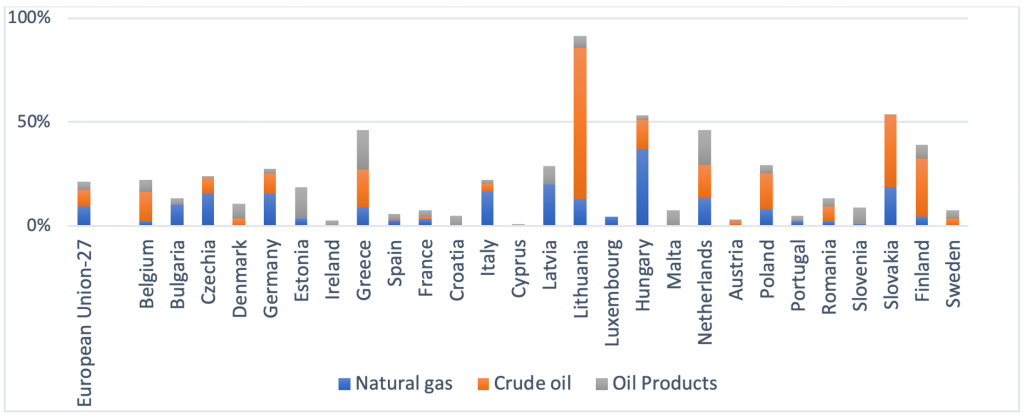
Note: See Figure 1. Source: Eurostat.
While the above data summarizes the EU dependency on Russian energy imports in volume terms, it is also useful to have a sense of the costs of this dependency. As we are not aware of any source that has accurate data on the value of imports across the EU states, we construct a back-of-the-envelope assessment of the costs of Russian energy imports to the EU in 2021 using the available trade data for 2021 and the allocation of imports across the EU Member States for 2020 (see Appendix 1 for more details). Admittedly, these estimates only account for the differences in prices of energy imports from Russia vs. other suppliers; it does not capture e.g., the difference in prices of Russian gas across the Member States. Still, they offer useful insight into the scope of these expenses, in levels (Figure 3) and the share of GDP (Figure 4).
The results suggest that, while the expenses are quite sizable – e.g., the total value of Russian fossil energy imports to the EU in 2021 exceeds 110 bln EUR, – they correspond to around 0.7% of European GDP. Again, there is variation across the Member States, but in most cases – effectively all cases that do not account for re-export – the share of Russian energy imports is below 2% of GDP.
Figure 3. Value of Russian fossil energy imports, bln EUR, 2021.
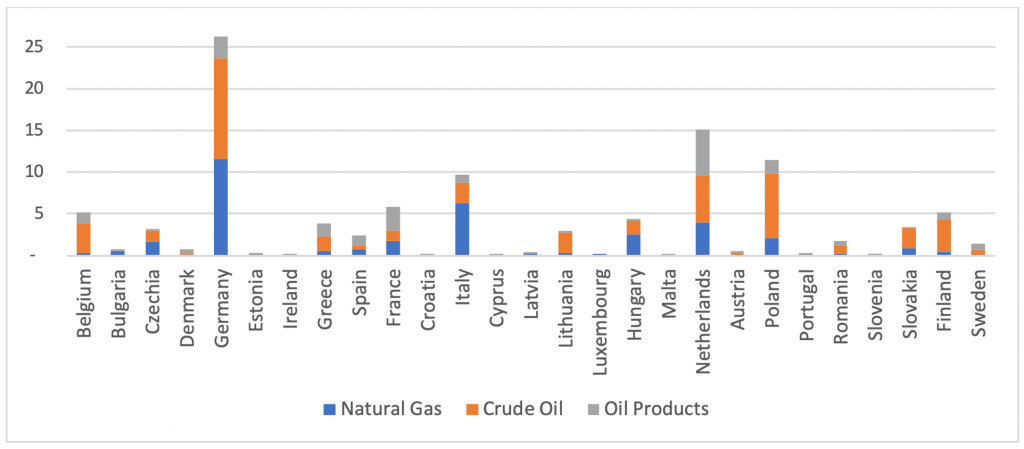
Source: Eurostat, GazpromExport, Central Bank of Russia, author’s own calculations, see Appendix 1.
Figure 4. Share of oil, oil products and gas imports in GDP, 2021.
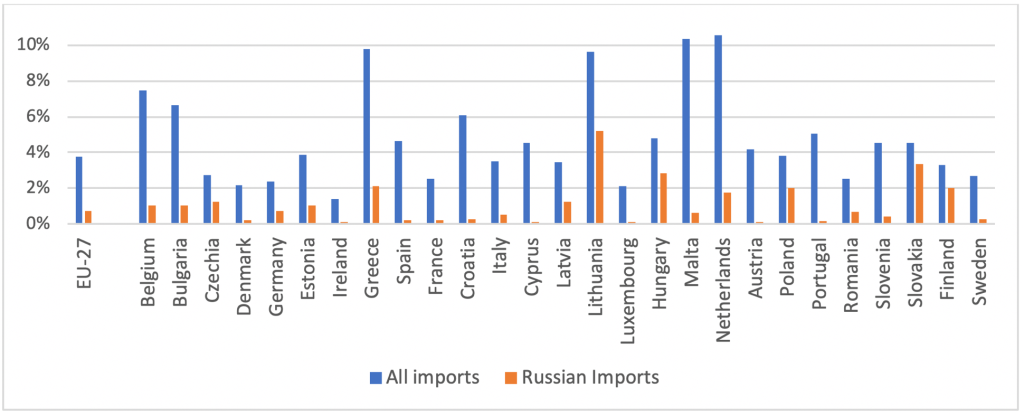
Source: Eurostat, GazpromExport, Central Bank of Russia, author’s own calculations, see Appendix 1.
Figure 4 also touches upon the second source of vulnerability towards a ban on Russian energy, mentioned at the beginning of this section. It depicts not only the value of Russian oil and gas imports as a percent of GDP but the overall dependency on imports of oil and gas as a share of GDP. The larger this dependency is, the bigger is the impact of an increase in energy prices for a country. Figure 4 not only confirms the abovementioned variation across the Member States but also shows that some countries with little-to-moderate direct dependency on Russian oil and gas – e.g., Portugal or Spain, – are still likely to experience a sizable negative shock to their energy expenses due to the market price increase.
Importantly, these figures give only a very rough representation of the potential damage that a ban on Russian energy imports may cause to the EU economies. Two EU Member States with a comparable dependency could react to the shortage of Russian gas in very different ways, depending on a variety of other factors – the extent and scalability of domestic production, diversification of their remaining energy portfolio in terms of energy suppliers and types of oil the economy relies on (e.g., light vs. heavy), energy infrastructure (e.g., LNG regasification facilities or storage), consumption structure, etc. Le Coq and Paltseva (2009, 2012) discuss in detail some of these factors, and the possibilities to account for them. However, for the sake of simplicity, in this brief we focus on the (volume- and value-based) measures of dependency.
Potential Costs of Russian Energy Import Ban
In this section, we discuss the potential implications of banning imports of Russian oil and gas on the costs of fossil energy imports in the EU. We offer a few historical parallels in order to assess the potential scope of the price reaction to such a ban. Furthermore, we proceed to provide estimates of the costs of oil and gas imports across the EU Member States, would such sanctions be implemented.
Oil Imports Ban
We start with a potential ban on Russian oil and oil product imports. To put things in perspective, it might be useful to present some numbers. According to the IEA, Russia recently surpassed Saudi Arabia as the world’s largest oil and oil products exporter. In December 2021, global Russian crude and oil product exports constituted 7.8 million barrels per day (mb/d), with exports of crude oil and condensate at 5 mb/d. Out of the total 7.8 mb/d, exports to OECD countries constituted 5.6 mb/d, with crude oil exports amounting to 3.9 mb/d. Assuming that the size of the global oil market in 2021 will be the same as in 2019, Russian crude oil exports to the OECD constitute 8.6% of global crude exports. The corresponding figure for oil products is 6.8% (BP, 2021).
So, what would happen if the developed world – which for the purpose of this analysis we proxy by OECD – bans Russian oil exports? In the recent public discussion, many voices have compared this potential development to the 1973 oil crisis. This crisis was initiated by OAPEC’s – the Arab members of OPEC, – oil embargo on the US in response to their support of Israel during the Yom Kippur War. The OAPEC, the biggest group of oil exporters at the time, completely banned oil exports to the US (and a number of other western countries), and also introduced production restraints that affected the global oil market. The (WTI) oil price during this episode went up by a factor of three (see, e.g, Baumeister and Kilian, 2016).
However, a few important features are likely to differ between the oil crisis of 1973 and the potential impact of the Russian imports ban. First, the net loss of oil supplies during the Arab embargo was around 4.4 mb/d, which at that point constituted around 14% of traded oil (Yergin, 1992). Recall that Russian supplies to OECD are around half of this share. Moreover, it is likely that the ban would not lead to a complete withdrawal of these amounts from the market, but rather to a partial rerouting of Russian oil to Asia and, consequently, a readjustment of world oil trade flows. Second, Yergin (1992) points out that, at the time of the 1973 oil crisis, oil consumption was growing at 7.5% per year, which exacerbated the impact of the embargo. In contrast, the current assessments of oil demand growth are at around 2% per year (IEA, 2022). Third, the energy portfolios are much more diversified now than in 1973, with gas and renewables playing a more substantial role. In the case of an isolated oil imports ban (not extending to gas imports), this would argue in favor of a more moderate price impact. Finally, the oil embargo of 1973 was a never-seen-before episode in the history of the oil market. The uncertainty about future developments has likely contributed to the oil price increase. While there is substantial uncertainty associated with the impact of a Russian oil imports ban, it is arguably lower than in 1973. Based on these considerations, a three-fold oil price increase in the case of a Russian oil export ban seems highly unlikely.
As a possible lower bound of the price impact, one can consider a much more recent price shock brought about by drone attacks on the oil processing facilities Abqaiq and Khurais in Saudi Arabia in 2019. In the initial assessment of the damage, Saudi Arabian authorities stated that the attack decreased the national oil production by 5.7 mb/d – which is more than the total of Russian oil exports to OECD. As a reaction, the intraday oil price went up by 20 %, and the daily oil price by 12%. In two weeks, production and export capacity was almost back to normal and the price returned to pre-shock levels.
Notice that the scale of the daily shortage in this episode exceeds the likely shortage under the Russian imports ban. However, a moderate price reaction, in this case, was clearly driven by expectations for the temporary nature of the shortage, as the damage was to be repaired in a matter of a few weeks, if not days. In comparison, the Russian oil ban is likely to last much longer. In this way, a price increase of 12%, or even 20%, would be an underestimation of the effect of a Russian oil imports ban.
While the above discussion suggests some bounds for the possible price effects of a Russian oil ban, the uncertainty around such price developments is very high. Figure 5 shows the cost estimates of oil and oil products imports to the EU for two potential price levels – $120/b, and $180/b. Each price would roughly correspond to an increase of 33%, and 100%, respectively, relative to the pre-invasion price of $90/b. In the estimation, we simplistically assume that the price of oil products increases by the same amount as the price of crude oil. We also assume that the missing Russian oil can be replaced by alternatives, such that oil consumption does not change compared to the 2021 level for the lower price scenario and that it decreases by 2% for the high-cost scenario due to the demand adjustments.
Figure 5. Estimated effect of Russian oil ban on oil and gas imports in 2022: value of oil and oil products imports, EUR bln (left axis), and oil import expenses relative to 2021 level (right axis).

Source: Eurostat, GazpromExport, Central Bank of Russia, author’s own calculations, see Footnote 1.
The estimates suggest that the total oil and oil products import costs for the EU would be just above EUR 640 bln for the $120/b price level and EUR 940 bln for the $180/b price level. Furthermore, the costs across the EU Member States would vary greatly depending on the size of the economy and its exposure to oil imports.
This shows that – provided that the Russian oil will be fully replaced but at a higher price – the expected cost of this is in the range of 1.7-1.9 times the 2021 expenses at 120$/b, and 2.5-2.8 times that if the price would be 180$/b. While there is some variation across Member States, mostly driven by the removal of the somewhat cheaper Russian oil from the consumption basket, it is rather limited. Figure 5 also demonstrates that the ban on Russian oil imports is going to affect not only countries that directly depend on Russian oil but also countries with large oil and oil products imports due to the market price effects.
Gas Imports Ban
Now we proceed to discuss the costs of banning Russian gas imports into the EU. While LNG has increased the fungibility of the natural gas market, it remains sizably segmented. Therefore, we concentrate on the effect on the European market.
Russian gas constituted around 39% of the EU gas consumption volumes in 2020, and just below 30% in 2021 due to restricted supply during the second half of the year (McWilliams, Sgaravatti and Zachmann, 2021). It is currently a common understanding that fully substituting 155 Bcm of Russian gas imports in 2021 with imports from other pipeline suppliers, LNG, storage, and increasing domestic production is not feasible in 2022. Different sources have given different estimates on the extent of the resulting shortage, see e.g. Table 1.
Table 1. Alternatives to replace EU imports of Russian natural gas
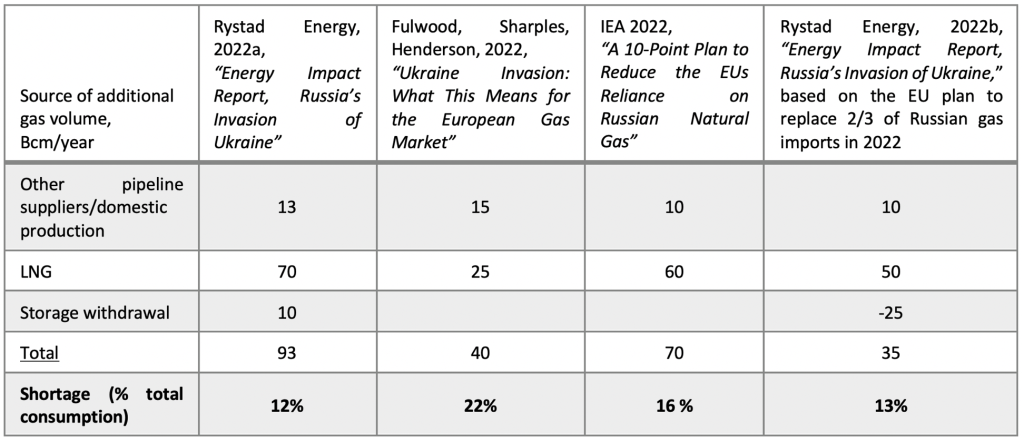
Source: Rystad Energy (2022a, 2022b), Fulwood et.al (2022), IEA (2022).
As shown in Table 1, the net missing gas consumption ranges between 12% and 22% across different scenarios. As there are no historical episodes in the gas market to which such a development can be compared, it is difficult to assess the potential price reaction. One rough comparison can be made based on the oil market situation during the Arab oil embargo of 1973 discussed above. Then, the net loss of oil constituted about 9% of the oil consumption in “the free world” (Yergin, 1982), even lower than the most optimistic prognosis in Table 1. However, 33 Mcb of Russian gas (or 6% of 2021 the EU’s gas consumption) has already been imported to the EU since the beginning of 2022, making the potential gas shortage quite comparable to the oil shortage of 1973. Subject to all differences between the two shocks, one can, perhaps, still argue that the gas price increase following a ban on Russian gas imports should not exceed three-fold from before the invasion.
It is important to stress here that the EU gas market situation in the case of the Russian gas embargo would be principally different from the oil market one. Due to supply shortage not coverable by the alternative gas sources, a gas embargo would lead not only to a stronger price increase than in the case of oil, but also to significant downward demand adjustments, rationing and, perhaps, even price controls. (This, again, parallels the developments during the 1973 oil crisis). The negative effect of such rationing is not accounted for by the import bill. On the contrary, a shortage of supply would imply lower gas import volumes, biasing the impact on the gas import bill downward. In this way, an import bill reaction to sanctions in the case of natural gas may more strongly underestimate the overall impact on the economy than in the case of oil.
While the above argument suggests a higher price increase in the case of a gas embargo in comparison to an oil ban, there is still a lot of uncertainty in forecasting the gas price. Figure 6 depicts the estimates for the natural gas cost across the EU for two potential price levels – EUR 160/Mwh, and EUR 240/Mwh, a two- and three-fold increase relative to the pre-invasion price level of EUR 80/Mwh. Both estimates assume a (moderate) 8% decrease in the demand reflecting the abovementioned supply shortage and demand adjustments. We assume that the shortage is affecting both the importers of Russian gas and those who use other suppliers due to the common gas market in the EU and the use of reverse flow technology – as was the case for Poland which was denied Russian gas on April 27th, 2022 due to not paying for it in Rubles (see Appendix 1 for a discussion of implications of this assumption).
Not surprisingly, the gas import costs increase drastically in comparison to 2021. The total figures for the EU would be just below EUR 680 bln in the two-fold price increase scenario, and exceed 1 trn EUR in the case of a three-fold increase, in contrast to EUR 185 bln in 2021. Again, the largest economies bear the highest costs in absolute value.
When it comes to the relative increase in gas import value, two further observations follow from Figure 6. First, there is a huge variation in the increase in the value of gas imports across the Member States, from no effect in Cyprus which does not import natural gas, to 7.7 times in the case of a price doubling and 11.5 times in the case of a price tripling. Again, this variation originates from the necessity to replace cheaper Russian gas with more expensive gas sources, and the effect is much stronger than for oil. However, just like in the oil case, the states not directly importing Russian gas will still experience a huge negative shock from such a price hike. (Recall also, that the variation of the impact across the Member States is likely underestimated here, as the gas bill does not account for potential rationing which may differentially impact the importers of Russian gas).
Second, the increase in the value of gas imports exceeds the scale of the price increase even for the least affected Member States (excluding Cyprus). This is due to the unprecedented gas price increase during the EU gas crisis that took place between late 2021 and the beginning of 2022. Due to this increase, the pre-invasion gas price in February 2022 was 60% higher than the average gas price in 2021.
Figure 6. Estimated effect of Russian natural gas ban on gas imports in 2022: value of gas imports, EUR bln (left axis), and gas import expenses relative to 2021 level (right axis).
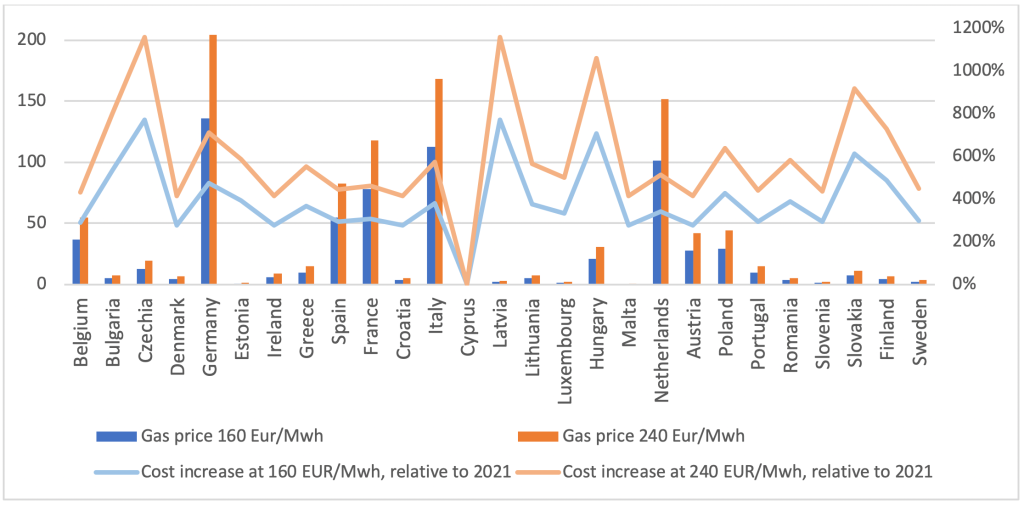
Source: Eurostat, GazpromExport, Central Bank of Russia, author’s own calculations, see Footnote 1.
Conclusions
The above estimates suggest that a ban on Russian oil and gas imports is going to be costly for the EU. While uncertainty is very high concerning the possible energy price increase following such a ban, historical parallels together with the market characteristics suggest that both the price increase and the rise in the value of imports are going to be stronger for natural gas. The resulting increase in the EU-wide import values relative to 2021 ranges from 1.8 to 2.6 times for the considered oil scenarios, and from 3.7 to 5.5 times for the natural gas scenarios.
Unsurprisingly, the most sizable import costs will be faced by the larger EU Member States, as well as those most dependent on oil and gas imports. However, all EU countries are going to be affected due to the market price increase. While the relative rise in the import costs of oil and oil products will be fairly uniformly met across the EU states, the increase in the costs of gas exports will vary greatly, with the largest relative losses faced by the EU states that are currently more exposed to Russian gas imports.
The above figures provide a rough assessment of the potential costs of a Russian fossil fuels ban. The approach does not take into account substitutability between different fuels and resulting cross-effects on prices, which implies that the costs could be both under- and overestimated. It has a very limited and simplistic take on the demand reaction to a price increase, which again may lead to either over- or underestimation of the effect. Neither does it account for the consequences of such price increases on the costs of electricity and implications for the non-energy sector within the economies. The latter may, again, be differentially affected depending on the industrial composition and their relative energy intensity. Another factor to consider is the interconnectivity between the EU economies – for example, an increase in Germany’s energy bill is likely to have a large impact on the entire EU. Moreover, the use of the import bill as a proxy for the overall effect on the economy may have further limitations in the case of supply shortage and rationing. To provide a more precise estimate of the impact of such a ban on the entire economy, for instance on GDP, one would require an extensive and sophisticated model along the lines of the CGE approach, relying on large amounts of data (Bachmann et al. (2022) provide an excellent example of such a study of the effect on Germany). This, however, is beyond the scope of the current assessment.
Still, even this relatively simplistic assessment of import costs of a Russian energy ban offers sufficient food for thought for the discussion of the scale of damage across the EU Member States and the feasibility of oil and gas sanctions. For example, the assessment suggests that an oil ban is likely to yield relative parity across the Member States in terms of the increase in the 2022 oil import bill as compared to the 2021 level. This would imply that, were the EU to decide on a gradual sanctioning of Russian oil and gas, it would be easier to reach an EU-wide agreement on oil sanctions. In turn, moving away from Russian gas – due to either the decision to ban gas imports or retaliation from Russia in response to oil sanctions, -implies very uneven import cost exposure. Thus, to face the challenge of replacing Russian gas imports, the EU would likely need to implement some kind of energy solidarity mechanism.
References
Disclaimer: Opinions expressed in events, policy briefs, working papers and other publications are those of the authors and/or speakers; they do not necessarily reflect those of SITE, the FREE Network and its research institutes.
Photo by Anton Galakhov, Wikimedia Commons. Creative Commons Attribution-Share Alike 4.0


