Democracy in the eye of the beholder?

There is growing concern that democratic institutions in Eastern Europe are fragile. This brief compares two perspectives on the state of democracy: expert assessments and surveys of the general population. We show that while experts’ perception of some countries’ institutions has worsened in recent years, voters are increasingly satisfied with their own democracies. This trend is broad-based, encompassing almost all new EU member states and all age groups. We provide evidence that over time, survey respondents’ assessment of democracy has become more closely tied to the outcome of elections rather than actual institutional change. Where governments have imposed restrictions on media freedom or judicial independence, their supporters continue to report high levels of satisfaction with the way democracy works.
“Across the world, democracy is backsliding”
- UN’s Secretary-General António Guterres, 2022
In recent years, the prevailing narrative around democracy in Eastern Europe has been negative. The reform momentum that propelled countries towards EU membership has not been sustained after accession. Discussions of global democratic backsliding frequently cite countries from the region as examples (Grillo and Prato, 2023; Chiopris et al., 2021; Mechkova et al., 2017). Following restrictions on judicial independence and media freedom, some new EU members have seen their ratings slide on indices that measure the quality of democratic institutions based on expert opinions. This brief contrasts these expert assessments with a different perspective on the state of democracy: that of the voters themselves.
Data from Eurobarometer surveys show that satisfaction with ‘the way democracy works in our country’ has been increasing in the new EU member states. This upward trend is visible for all age groups and in almost all countries – including those where experts’ assessment of democracy has worsened. We document patterns in the data that may help to explain this divergence. Survey responses increasingly reflect an instrumentalist view of democracy; respondents who are aligned politically with the winning party are more likely to feel that democracy is working well. This trend can be observed across the EU, but it is most pronounced in the new EU member states where the governing parties are right-of-centre.
Perceptions of democracy
Expert assessments
The quality of democracy is hard to measure. A range of indices classify countries by regime type or provide numerical ratings of institutional quality (the Polity, V-Dem, and Freedom House measures are among the most prominent). These indices have somewhat different objectives and methodologies, but they all rely on subjective judgements by expert coders.
Some academic research casts doubt on the prevailing narrative of a global phenomenon of democratic backsliding. For instance, Treisman (2023) and Lueders and Lust (2018) show that there is little consensus across indices, both in terms of individual countries and the global trend. A recent paper by Little and Meng (2023) contrasts subjective indices with more objective indicators of democratic health (e.g. the rate at which incumbents lose elections). The authors find no evidence for global democratic backsliding using the objective measures and suggest that the pessimistic narratives around democracy may have biased coders’ assessment.
There is less disagreement about the development of democracy in Eastern Europe. Treisman (2023) cites Hungary as the only example of a country that has recently been downgraded both from the status of “liberal democracy” by V-Dem and “free state“ by Freedom House. Little and Meng (2023) highlight three cases where both objective and subjective measures indicate backsliding: Hungary and Poland (as well as Venezuela). Further, Becker (2019) shows that downgrades to V-Dem democracy scores in Bulgaria, Czechia, Hungary, Poland, and Romania are relatively broad-based, driven by declines across multiple sub-categories including freedom of expression and constraints on the executive.
Surveys of public opinion
We use individual-level data from the Eurobarometer – a survey of public opinion in the EU Member States and candidate countries conducted by the European Commission. The surveys are conducted at an approximately monthly frequency and comprise of a representative sample (about 1000 face-to-face interviews) for each state. We combine data from 42 surveys, spanning 20 years (2002 to 2022), with a total of 1.3 million respondents. The main question we are interested in is: “On the whole are you very satisfied, rather satisfied, not very satisfied or not at all satisfied with the way democracy works in [our country]?”
At the beginning of the sample period in 2002, around a third of respondents in Eastern European EU countries were satisfied with their respective democracies compared to close to twice as many respondents in Western Europe (Figure 1). Over the past 20 years, the share of Eastern Europeans satisfied with their democracy has grown to around 50 percent, narrowing the gap with Western Europe. Figure 2 shows that this pattern is broad based across age groups. All cohorts of Eastern Europeans are more satisfied with democracy than earlier generations and among the youngest respondents, satisfaction is almost as high as in Western Europe.
Figure 1. Satisfaction with Democracy vs V-Dem Score.
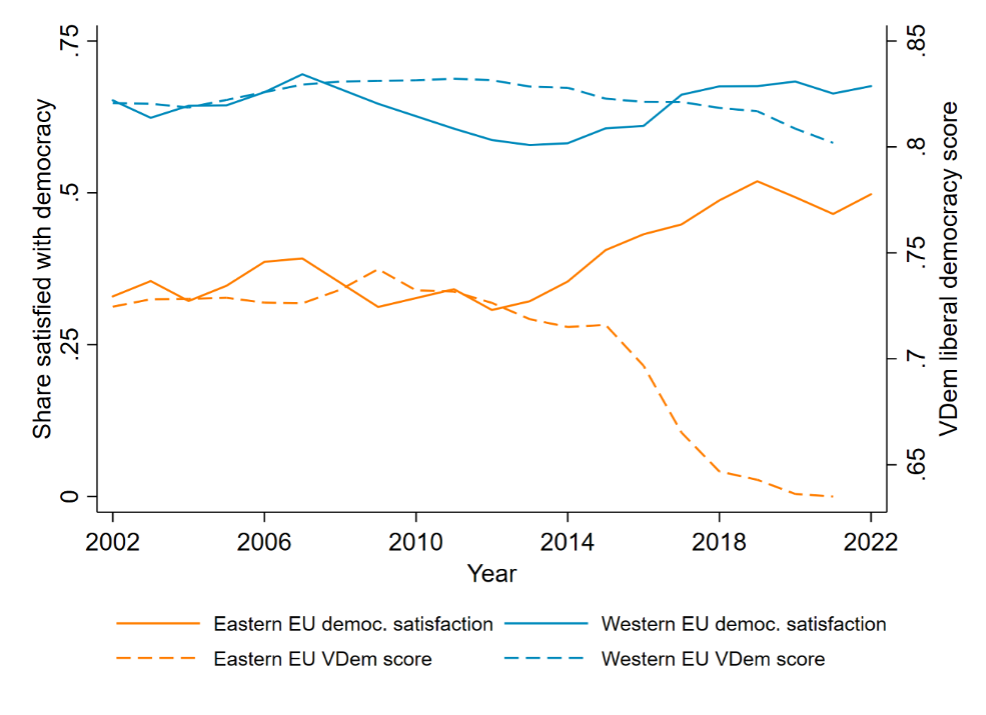
Source: Eurobarometer, V-Dem and authors’ calculations.
Figure 2. Satisfaction with Democracy by Age Group.
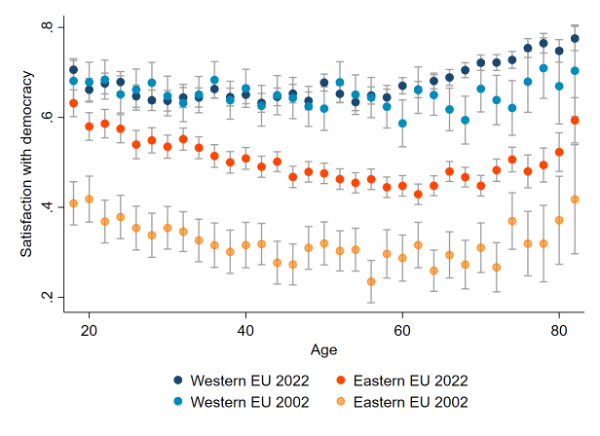
Notes: Each point shows the sample mean for a single year cohort. 95 percent confidence intervals in grey. Source: Eurobarometer, authors’ calculations.
Figure 1 also shows a stark divergence in expert assessment of the state of democracy in Eastern Europe compared to public opinion in the same countries. While the V-Dem democracy scores for Eastern Europe have declined rapidly since the mid-2010s, average satisfaction with the own country’s democracy has increased. A much smaller gap between these two measures has also started to open up in Western Europe over the past couple of years.
In Figure 3, we show the same patterns of satisfaction with democracy and expert opinions for individual countries. Satisfaction with one’s own democracy has increased in almost all Eastern European countries, including in Poland and Hungary which at the same time showed the largest declines in democracy scores.
Figure 3. Satisfaction with Democracy vs V-Dem Score by Country.
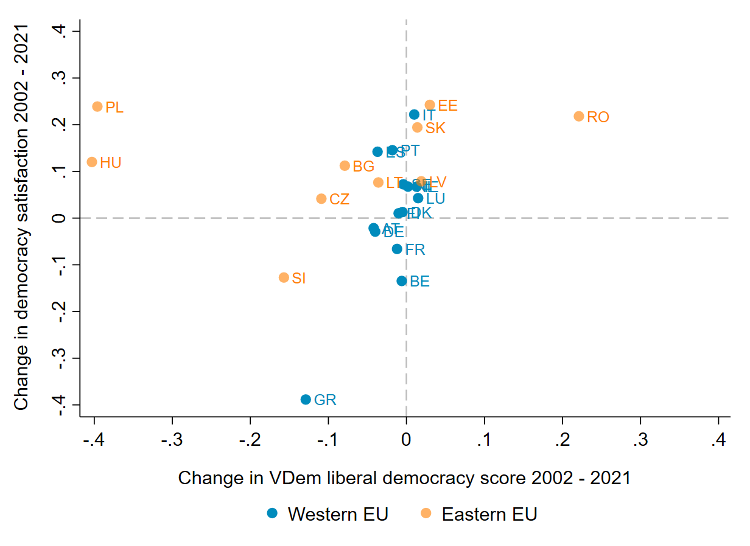
Source: Eurobarometer, V-Dem and authors’ calculations.
This divergence in individual survey responses and expert assessments is not altogether surprising. First, the Eurobarometer surveys a sample of the population in each country, while V-Dem (and most other similar democracy indices) relies on country experts. Another likely explanation for the difference is the interpretation of the question. Democracy ratings tend to emphasise institutional aspects of a democracy, for instance, the V-Dem liberal democracy index is designed to capture rule of law and checks on executive power (see, e.g., Becker, 2019). In contrast, the survey responses are likely to reflect both satisfaction with the state of democracy in a country, as well as the outcomes of that democracy.
Satisfaction with Democracy and Political Alignment
In this section, we investigate whether stated satisfaction with democracy depends on the outcomes of elections and the political ideology of the respondents. A common way of measuring political ideology is the placement on a right-left scale, where the right favours a free-market economy and traditional values while the left favours economic redistribution and socially progressive policies. We compare the right-left placement of each country’s governing party as coded by the Chapel Hill Expert Survey (CHES), with the self-identified right-left placement of Eurobarometer respondents. We calculate the ideological distance from the government as the absolute difference between these two scores.
Figure 4. Relationship Between Ideological Distance from Government and Satisfaction with Democracy.
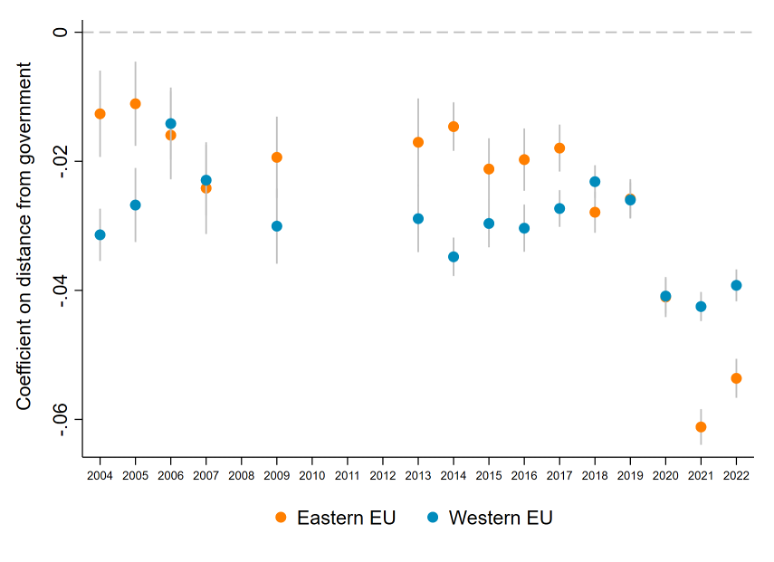
Notes: Each point shows the coefficient from a separate regression of satisfaction with democracy on ideological distance from government, age, gender, year fixed effects and country fixed effects. 95 percent confidence intervals in grey. Coefficient estimates for Eastern and Western EU overlap on the chart for 2019 and 2020. Source: Eurobarometer, Döring, Huber and Manow (2022) and authors’ calculations.
We find that people are on average less satisfied with their country’s democracy when they are ideologically further from the parties in government (Figure 4). This is consistent with prior evidence (Anderson and Guillory, 1997; Ezrow and Xezonakis, 2011). The alignment effect has become stronger over time – even when taking into account average satisfaction levels for each country and demographic characteristics of the respondents, such as their age and gender. In the past three years, political alignment with the government has become a major factor in explaining satisfaction with democracy, especially in Eastern Europe. Svolik (2019) suggests that voters trade off democratic principles and partisan interests. As political polarisation increases, voters become more willing to accept a government that undermines democratic institutions, as long as it is on ‘their side’ ideologically.
Figure 5. Satisfaction with Democracy and Political Ideology. Western Europe in the Left Panel and Eastern Europe in the Right Panel.
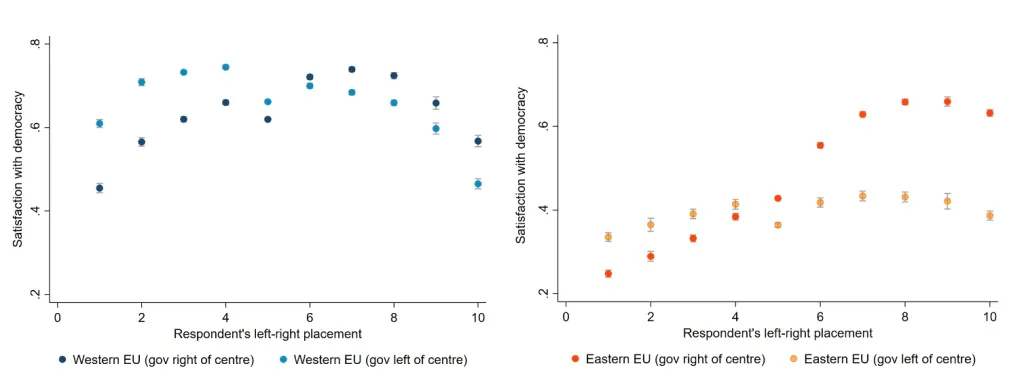
Notes: Respondents with the most left-leaning ideology are at the extreme left of the x-axis, those with the most right-leaning ideology are at the extreme right. The sample covers the period 2002 to 2022 and excludes observations where the government is coded as centrist (scores of 5-6 in the CHES data). 95 percent confidence intervals in grey. Source: Eurobarometer, Döring, Huber and Manow (2022) and authors’ calculations.
In Figure 5, we break down the effect of political alignment on satisfaction with democracy according to individuals’ political leanings. On the x-axis is the respondents’ left-right placement and on the y-axis there are two series of dots showing satisfaction with democracy depending on whether the government is left of centre (lighter coloured dots) or right of centre (darker coloured dots). As before, being politically aligned with the government increases satisfaction, that is, to the left of the chart, the lighter coloured dots are placed higher than the darker coloured dots and vice versa for the right of the chart. The further from centre a person’s political leanings, the less satisfied they are with a government of the opposite ideology. There is also some evidence of asymmetry across the political spectrum in Eastern Europe, with respondents on the political right reporting much higher levels of satisfaction with right-wing governments compared to voters on the left under a left-wing government.
Conclusion
Over the past decade, there has been increasing concern over democratic backsliding in some of the Eastern European countries that are members of the EU. This is reflected in commonly used democracy indices whose country experts note the worrying trends in countries’ institutions – such as the reduction of freedom of expression, the strengthening of rule of law and constraints on the executive, all hallmarks of a liberal democracy. In this policy brief, we investigate whether this erosion of institutional safeguards affects people’s stated satisfaction with democracy in one’s respective country. We find a broad-based increase in satisfaction with democracy in the Eastern European EU countries, including in the countries that have seen some of the largest declines in liberal democracy ratings. We show that stated satisfaction with democracy reflects less the institutional changes in countries, but more the outcome of democratic elections. Voters who are politically aligned with their government are systematically more likely to report that they are satisfied with the state of democracy in their country. And this effect has become stronger in the most recent years, particularly in the Eastern European EU countries. We also find that this effect is not symmetric across the political spectrum. In the Eastern European EU countries, respondents on the political right are more satisfied with right-wing governments than those on the left are with left-wing governments.
The descriptive patterns outlined in this policy brief illustrate a worrying disconnect in the minds of many voters between institutions and outcomes of the democratic process. The threat of democratic backsliding in Europe and across the globe is predominantly not due to electoral democracies being replaced by autocratic regimes. Rather, genuinely popular (and often populist) governments are democratically elected and, once in power, proceed to undermine and dismantle liberal democratic institutions, such as a free press, an independent judiciary, and a fair electoral system. This process in turn makes it more difficult for opposition parties to win future elections, further cementing the power of the rulers of these illiberal democracies. While the electorate might support these governments now, voters need to be aware that these liberal institutions are designed to safeguard their democratic future.
Disclaimer: Opinions expressed in events, policy briefs, working papers and other publications are those of the authors and/or speakers; they do not necessarily reflect those of SITE, the FREE Network and its research institutes.
Photo: Pixelvario /Shutterstock


