Paradise leaked: An analysis of offshore data leaks

For instance, the number of offshore entities linked to a country increases significantly when that country experiences a change in political leadership. By contrast, financial sanctions on a given country result in a reduction in the number of established offshore entities. In the immediate aftermath of the financial crisis, many countries signed bilateral treaties with tax havens in order to promote transparency. Our analysis of the leaked data shows that the overwhelming majority of offshore entities are not governed by these treaties.
Offshore Tax Haven Leaks
Zucman (2013) estimates that household wealth held in offshore tax havens is equivalent to 10% of world GDP. While there are many legitimate reasons for wealthy individuals to use offshore financial services, the secrecy surrounding offshore holdings has also enabled tax evasion and money laundering. The international community has launched several initiatives trying to increase the transparency of offshore wealth holdings. Over the past decade, several large collections of documents from offshore financial service providers have been leaked to the media: Pandora Papers (2021), Paradise Papers (2017/2018), Bahamas Leaks (2016), Panama Papers (2016), and Offshore Leaks (2013). Investigative journalists have used information from the leaks to expose many instances of secretive financial dealings linked to political leaders. Examples from FREE network countries include: the connections between a close ally of Belarussian President Alexander Lukashenko and a gold mining venture in Zimbabwe, the offshore business holdings of past and present Ukrainian presidents and their respective allies, and the wealth of Russian President Vladimir Putin’s close associates and childhood friends (see, for instance, Cosic 2021, Mylovanov and Mylovanova 2016).
The International Consortium of Investigative Journalists (ICIJ) has made public information on more than 800,000 offshore entities that are part of the offshore data leaks (see ICIJ Offshore Leaks database). The data contain information on the names of companies or people who set up offshore entities, their country of origin, the offshore jurisdiction, and the dates of incorporation and deactivation for offshore entities.
What Can We Learn from the Data?
Despite the wealth of information that this database contains, there has been relatively little academic research using the offshore leaks data. Two notable exceptions are Alstadsæter, Johannesen and Zucman (2019), and Londoño-Vélez and Ávila-Mahecha (2021), who link information from the Panama Papers to administrative records from Scandinavia and Columbia, respectively. They find that tax evasion is concentrated among the richest households. Guriev, Melnikov and Zhuravskaya (2021) use the revelation of the Panama Papers to study its effect on perceptions of corruption.
There are several challenges to using the offshore leaks data for systematic data analyses. First, there are both legitimate and illegal uses of offshore financial services, and without further information, it is not possible to distinguish between them. Second, as this information is obtained through leaks at specific offshore services providers, the data are unlikely to be representative of overall offshore financial activity. Third, there is no information on financial transactions, and we do not know the amounts of money involved in the offshore entities. Finally, more sophisticated offshore structures may make it impossible to deduce the ultimate owner of each entity and its country of origin. Especially for the second and third reasons, economists have tended to focus on balance of payments statistics and cross-border bank deposit data when estimating flows to offshore accounts. For example, Andersen, Johannesen, Lassen and Paltseva (2017) show how the oil wealth of countries with weak institutions is diverted into secret offshore accounts. Becker (2019) investigates recent trends in Russian capital flows and shows that a significant share of Russian money flows to Western European banks. See also Nyreröd and Spagnolo (2018, 2021) for discussions of the role of European banks in recent money laundering scandals.
With these caveats in mind, Figure 1 shows the correlation between the number of offshore entities in the data (on the y-axis) and the offshore wealth holdings of each country’s households (on the x-axis) as estimated by Alstadsæter, Johannesen and Zucman (2018). While the chart shows a positive correlation of 0.56 between these two measures, it also illustrates that the number of leaked entities may be a poor proxy for the stock of offshore wealth. Countries with a significant fraction of offshore wealth in European tax havens are underrepresented in the leaks (e.g., France, Germany, and Italy) while the UK, Russia, and Latvia account for a disproportionate share of leaked offshore entities.
Figure 1. Number of offshore entities and estimated offshore wealth
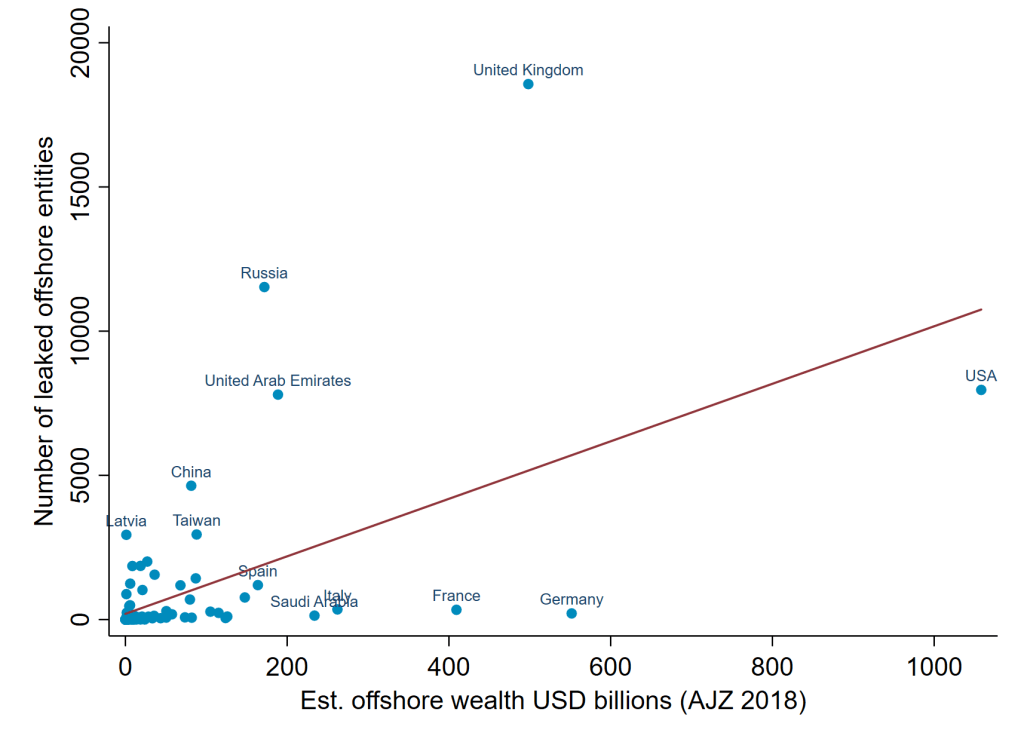
Source: ICIJ Offshore Leaks database, Alstadsæter, Johannesen and Zucman (2018) and authors’ calculations.
Timing of Offshore Entity Creation
While the number of overall leaked entities per country might not be a perfect measure of the amount of offshore wealth, we find that there are systematic patterns in the timing of the creation of offshore entities. In particular, more offshore entities are created when individuals face political uncertainty in their own countries and fewer offshore entities are created by individuals from countries under financial sanctions.
Elections and Change of Leadership
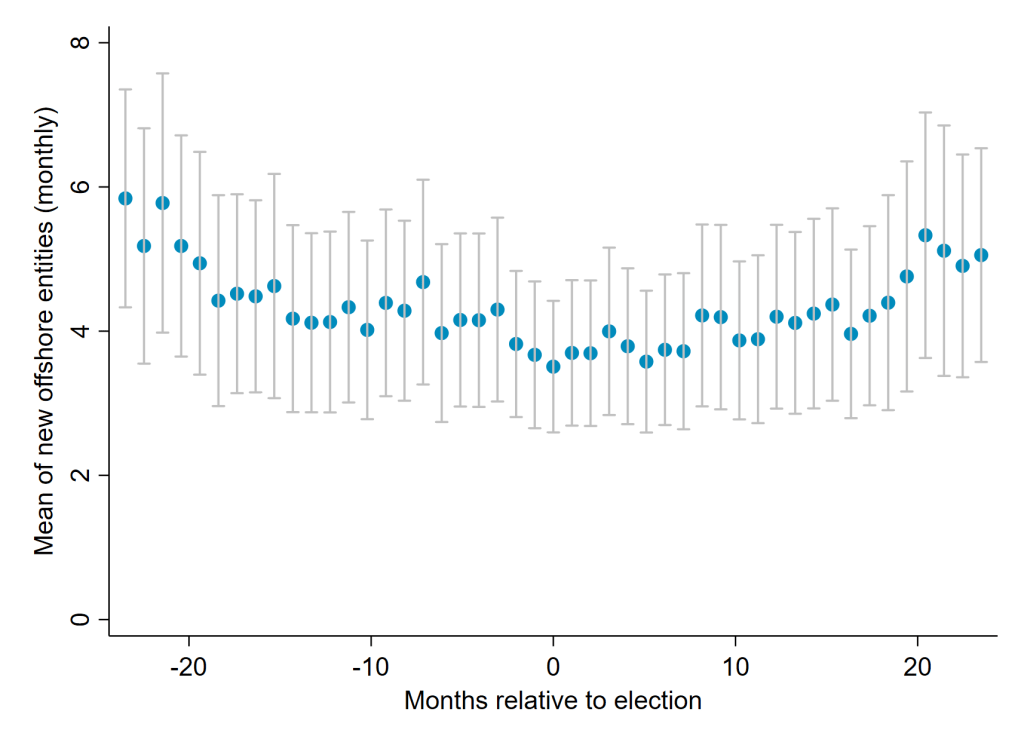
Figure 2 shows the average number of newly incorporated offshore entities linked to a given country (on the y-axis), depending on that country’s political situation. Panel A shows no clear pattern of offshore entities being created by companies or individuals around the time of elections. Elections are often predictable and frequently result in the reelection of the incumbent government. In contrast, Panel B shows a clear increase in the number of offshore entities linked to a country around the time when that country experiences a change in the de facto political leader. Around four months before there is a change in political leadership, the average number of entities created per country per month almost doubles. Offshore entity creation falls back to normal levels typically around half a year following the transition of power. This pattern suggests that wealth leaves countries at times of political uncertainty and is consistent with the findings of Andersen, Johannesen, Lassen and Paltseva (2017) and Earle, Shpak, Shirikov and Gehlbach (2021).
Figure 2. Offshore entity creation and national political situation
Panel a. Elections
Panel b. Change of political power
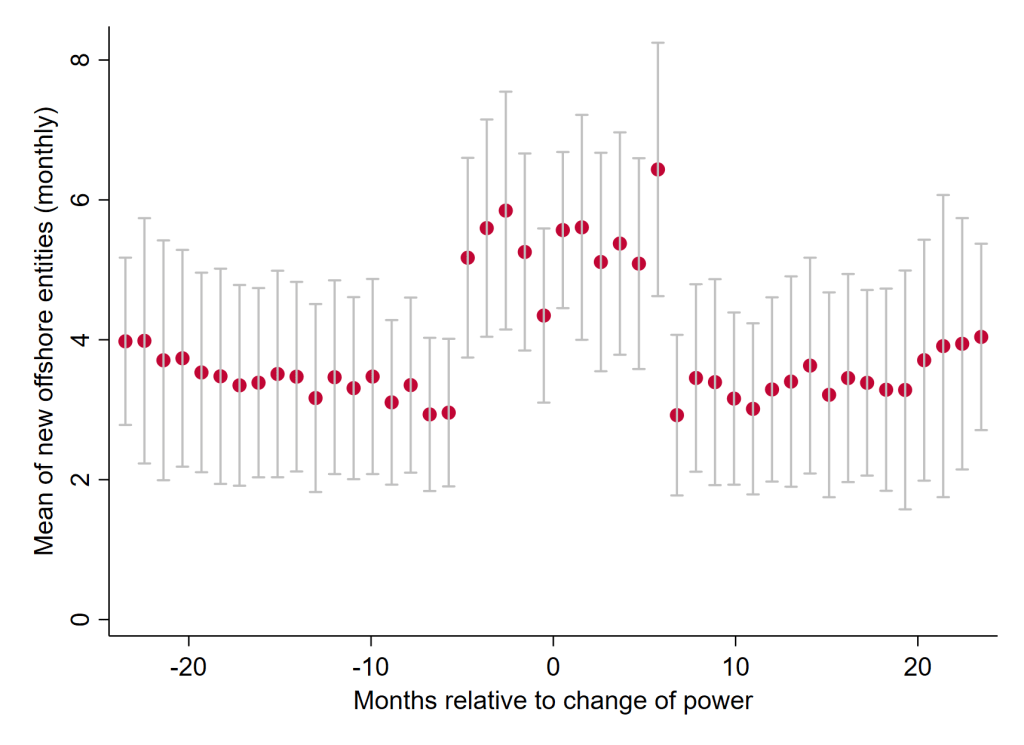
Source: ICIJ Offshore Leaks database, The Rulers, Elections, and Irregular Governance (REIGN) Dataset and authors’ calculations. A change of power is defined as a change in the de-facto political leader (e.g., due to the incumbent losing an election or the collapse of a coalition government).
International Sanctions
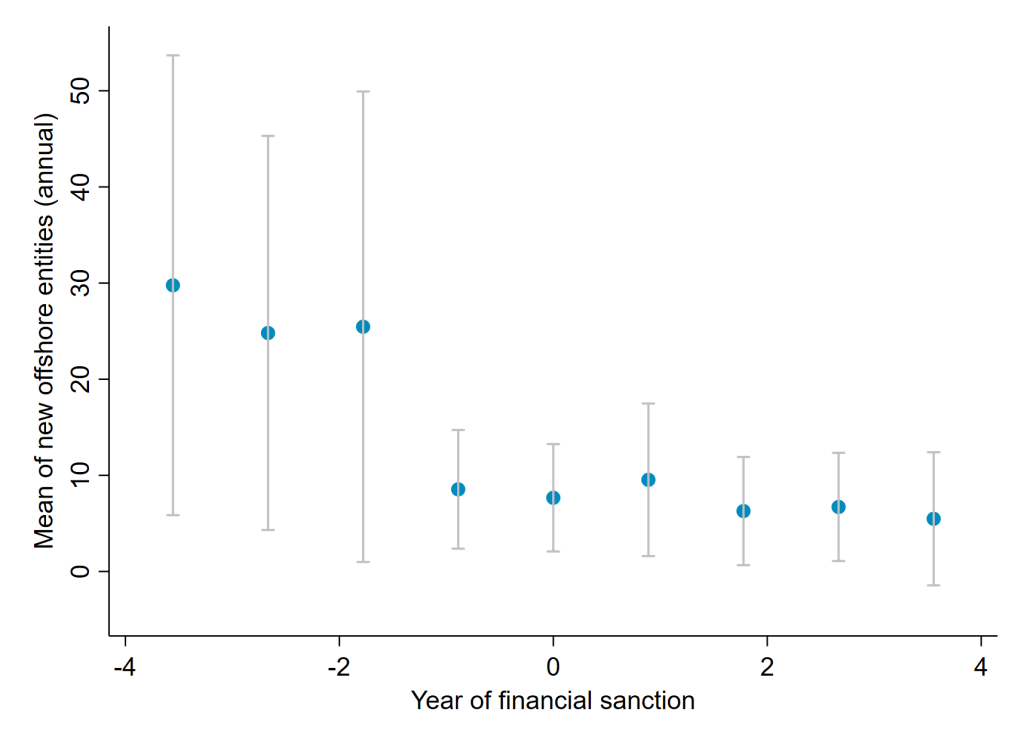
Figure 3 shows the impact of sanctions from the United Nations, European Union, and the United States on the average number of offshore entities linked to a given country (on the y-axis). Panel A shows that when a country is subject to financial sanctions, the number of linked offshore entities created falls to around 10 per year from an average of 25 before the introduction of sanctions. The impact of sanctions can already be seen in the year before the start of the sanctions, which could reflect measurement and reporting errors or anticipation of the sanctions. In contrast, Panel B shows that trade sanctions that are not accompanied by financial sanctions have no significant impact on offshore activities. These charts suggest that financial sanctions may have some impact on how much capital can be moved from countries under sanctions to offshore accounts.
Figure 3. Offshore entity creation and international sanctions
Panel a. Financial sanctions
Panel b. Trade (without financial) sanctions
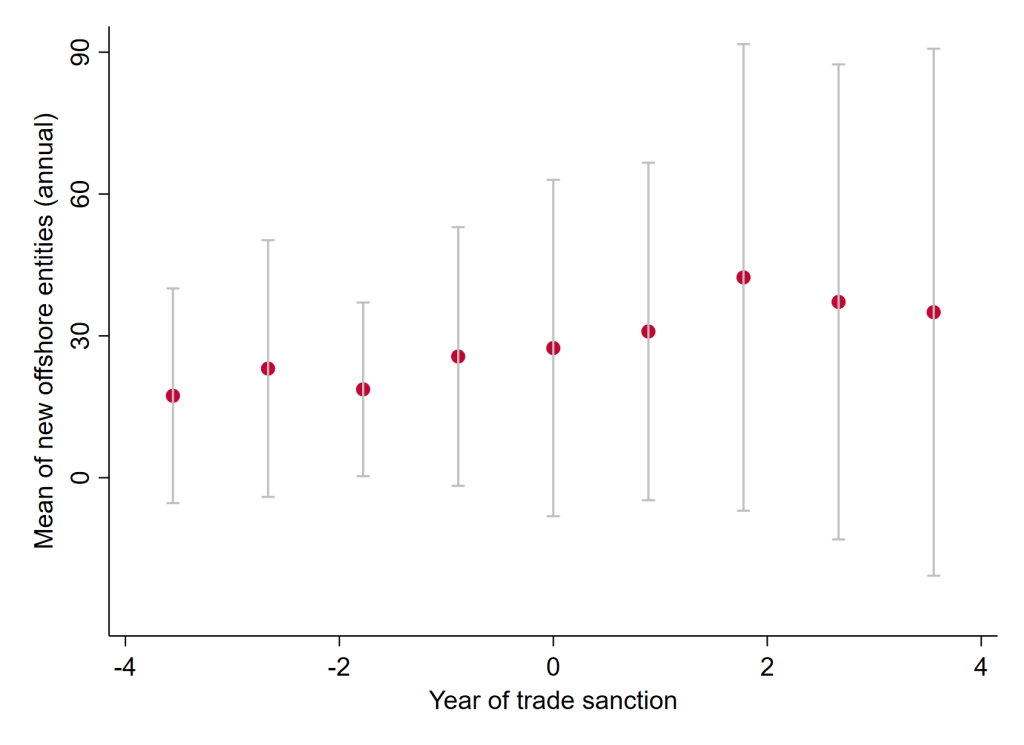
Source: ICIJ Offshore Leaks database, Global Sanctions Data Base and authors’ calculations.
Promoting Transparency
After the Financial Crisis in 2009, G20 countries compelled offshore tax havens to sign bilateral treaties to allow for the exchange of banking information under the threat of economic sanctions. More than 300 treaties were signed by tax havens that year. The effectiveness of this policy has been debated. For instance, Johannesen and Zucman (2014) show that the treaties lead to a relocation of bank deposits from compliant to less compliant offshore tax havens.
The G20 crackdown required each tax haven to sign at least 12 bilateral treaties. Relative to a comprehensive multilateral agreement, this policy had two limitations. Firstly, it leaves room for the diversion of funds identified by Johannesen and Zucman (2014). Secondly, tax havens were able to choose freely among potential partner countries – regardless of the underlying financial flows. Figure 4 shows that only a small fraction of the entities in the offshore leak database have a country of origin that signed a treaty with the tax haven in which they were incorporated. In addition, the small share of entities that will be subject to treaties suggests that havens did not always sign treaties with the most important counterparts. While the leaked entities may not be representative of offshore finance as a whole, this picture appears inconsistent with the OECD’s claim that “the era of bank secrecy is over” (OECD 2011)
Figure 4. Entity creation by treaty status
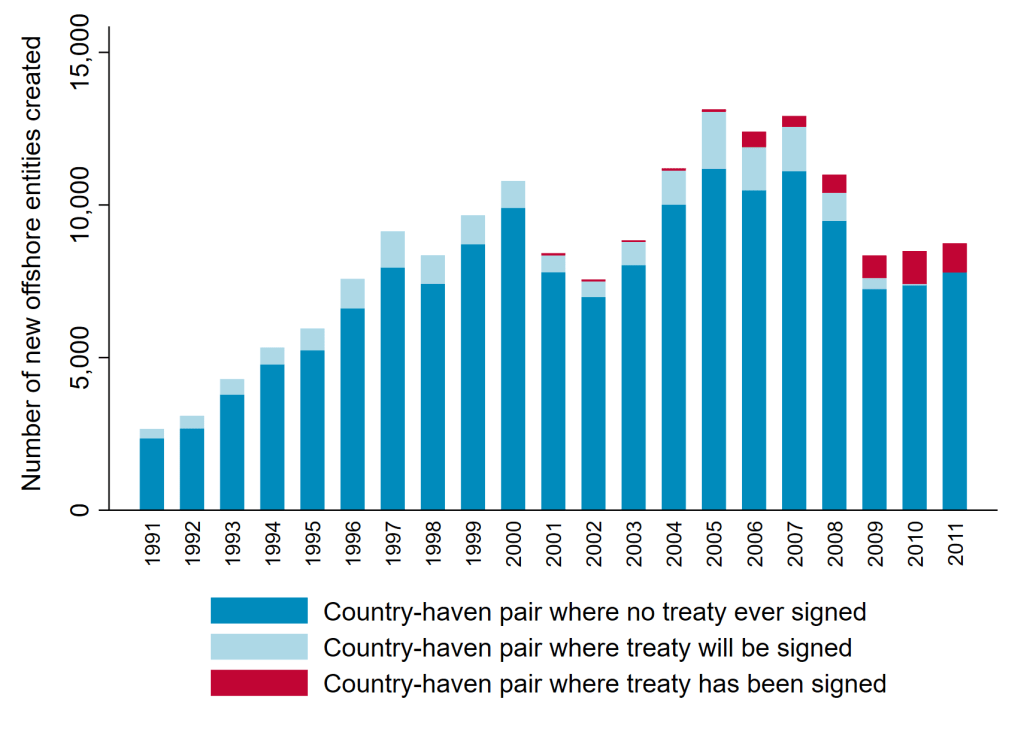
Source: ICIJ Offshore Leaks database, treaty events from Johannesen and Zucman (2014) and authors’ calculations.
Conclusion
A series of leaks over the past decade have exposed over 40 million documents related to the secretive offshore financial industry. Information related to over 800,000 offshore financial entities has been made public by the ICIJ. While a few high-profile cases received significant media coverage and gave rise to further investigations, the vast majority of references to networks of individuals, trusts, and shell corporations are difficult to decipher. This brief argues that, collectively, these leaked documents can be informative. They can be used to analyze the reasons for moving money offshore (such as domestic political uncertainty) as well as the constraints individuals face when doing so (such as international sanctions or bilateral treaties on bank secrecy).
In an effort to further increase transparency, 102 jurisdictions committed to a new standard for the automatic exchange of certain financial account information between tax authorities from 2019. Until such reforms are successful, leaks by whistleblowers are likely to remain a valuable source of information on the offshore financial industry.
Reference
Disclaimer: Opinions expressed in events, policy briefs, working papers and other publications are those of the authors and/or speakers; they do not necessarily reflect those of SITE, the FREE Network and its research institutes.