Understanding Russia’s GDP numbers in the COVID-19 crisis
The aggregate real GDP decline would have been almost three times greater than in the official statistics if changes in exports were computed in a way that better reflects their value. In particular, the real GDP calculation uses changes in volumes rather than values to omit inflation, but for exports, it thus ignores large changes in international oil prices. In the end, what the government, companies, and people in Russia can spend is much more closely related to how much money is earned on its exports than how many barrels of oil the country has sold to the rest of the world. More generally, this means that real GDP growth in Russia is not a very useful statistic in years with large changes in oil prices, as was the case in 2020, since it does not properly reflect changes in real income or spending power. When policymakers, journalists, and scholars now start to compare economic developments across countries in the covid-19 pandemic, this is something to bear in mind.
Introduction
The world is closing the books on 2020 and it is time to take stock of the damage done by the COVID-19 pandemic thus far. A year into the pandemic, over 100 million cases have been confirmed and almost 2.5 million people have died worldwide according to ECDC (2021) statistics. Russia has not been spared and Rosstat reported 4 million infected and over 160 000 dead in 2020.
Human suffering in terms of lost health and lives is certainly the main concern in the pandemic, but on top of that comes the damage done to economies around the world. Falling incomes, lost jobs, closed businesses, and sub-par schooling will create significant health and other problems even in a fully vaccinated world for years to come.
Understanding how real GDP has fared in the crisis does not capture all of these aspects, but some. With the IMF’s latest World Economic Outlook update on economic performance out in January 2021, it is easy to start comparing GDP growth across countries (IMF, 2021). GDP growth is a standard measure of past performances in general, but the numbers for 2020 may also enter various domestic and international policy discussions of what does and does not work in protecting economies in the pandemic. For countries that seem to have fared better than their peers, the growth numbers are likely going to be used by incumbent politicians to boost their ratings or by consumers and business leaders making plans for the future.
In short, real GDP numbers are important to most economic and political actors, domestically and globally, with or without a crisis unfolding. It is therefore important to understand how Russia, a major oil exporter with significant losses of lives and incomes in the pandemic, could report a real GDP decline of only 3 percent in 2020 (Rosstat, 2021). Although this is not far from the global average reported by the IMF (2021), it is far better than the 7.2 percent drop in the Euro area, 10 percent fall in the UK, or 7.5 to 8 percent declines of its BRICS peers, South Africa and India. This brief provides the details to understand that Russia’s performance is more of a statistical artifact than a fundamental reflection of the health of the Russian economy.
Oil prices, GDP growth, and the ruble
Russia’s dependence on exporting oil and other natural resources is well documented (see for example Becker, 2016a and 2016b) and often discussed by Russian policymakers and pundits. In particular, changing international oil prices is a key determinant of growth in the Russian economy. Even if the level of real GDP disconnected from oil prices somewhere between 2009 and 2014 (Figure 1), the link between real GDP growth and changes in oil prices persists (Figure 2).
Figure 1. Russia real GDP and oil prices
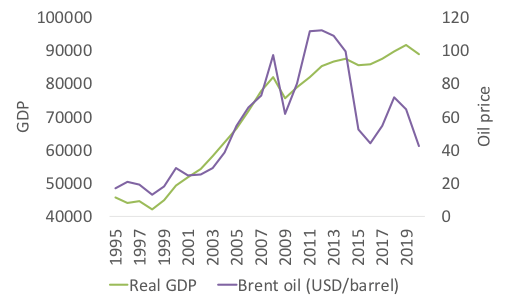
Source: Author’s calculations based on U.S. Energy Information Administration and Rosstat.
The empirical regularity that still holds is that, on average, a 10 percent increase (decline) in oil prices leads to around 1.4 percent real GDP growth (fall), see Becker (2016a). With a 35 percent decline in oil prices in 2020, this alone would lead to a drop in GDP of around 5 percent.
Figure 2. GDP growth and oil price changes
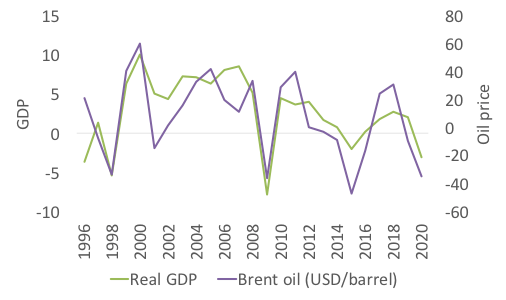
Source: Author’s calculations based on U.S. Energy Information Administration and Rosstat.
One factor that has a fundamental impact on how the relationship between oil prices and different measures of GDP changes over time is the ruble exchange rate. For a long period, Russia had a fixed exchange rate regime with only occasional adjustments of the rate. A stable exchange rate was the nominal anchor that should instill confidence among consumers and investors. However, when changes in the oil prices were too significant, the exchange rate had to be adjusted to avoid a complete loss of foreign exchange reserves. This was evident in the 90’s with the crisis in 1998 and later in the global financial crisis in 2008/09. Eventually, this led to a flexible exchange rate regime and in 2014, Russia introduced a flexible exchange rate regime together with inflation targeting as many other countries had done before it.
As can be seen in Figure 3, this has important implications for how changes in international oil prices in dollars are translated into rubles. Note that the figure shows index values of the series that are set to 100 in the year 2000 so that values indicate changes from this initial level. Starting in 2011, but more prominently since 2014, the oil price in rubles has been at a significantly higher level compared to the oil price measured in dollars, which is of course due to the ruble depreciating. This affects the government’s budget as well as different measures of income in rubles. However, if oil prices in dollars change, this affects the real spending power of Russian entities compared with economic actors in other countries regardless of the exchange rate regime. Moving to a flexible exchange rate regime was inevitable and the right policy to ensure macroeconomic stability in Russia when oil prices went into free fall. Nevertheless, it does not change the fundamental economic fact that falling oil prices affect the real income of an oil-exporting country. It also makes it even more important to understand how real GDP is calculated.
Figure 3. Oil prices and exchange rate indices
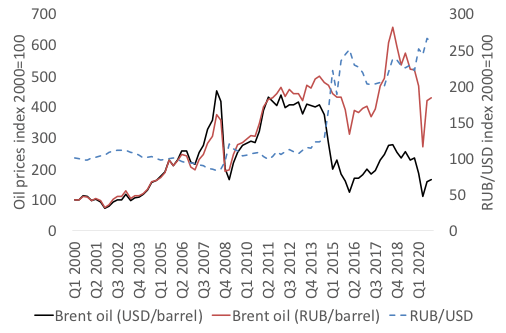
Source: Author’s calculations based on U.S. Energy Information Administration and Central Bank of Russia.
The components of real GPD
GDP is an aggregate number that can be calculated from the income or expenditure side. The focus in this brief is on the expenditure side of GDP. The accounting identity at play is then that GDP is equal to private consumption plus government consumption plus investments (that can be divided into fixed capital investments plus change in inventories) plus exports minus imports (where exports minus imports is also called net exports). Being an accounting identity, it should add up perfectly but in the real world, components on both the income and expenditure sides are estimated and things do not always add up as expected. This generates a statistical discrepancy in empirical data.
Another important note on real GDP (rather than nominal GDP measured in current rubles) is that the focus is on how quantities change rather than prices or ruble values. The idea is of course to get rid of inflation and focus on, for example, how many refrigerators are consumed this year compared to last year and not if the price of refrigerators went up or down. This may sound obvious, but it comes with its own problems concerning implementation and interpretations. For Russia, real GDP becomes problematic because its main export is oil (gas and its related products). The price of oil is just one of many drivers of Russia’s inflation but is an extremely important driver of its export revenues and growth as has been discussed above. On top of that, oil prices are volatile and basically impossible to control for Russia or even the OPEC.
So why does this matter for understanding Russia’s real GDP growth in 2020? The answer lies in how the different components of real GDP are computed. To make this clear, the evolution of the components between 2019 and 2020 is shown in Table 1.
Table 1. Russia’s GDP components from the expenditure side
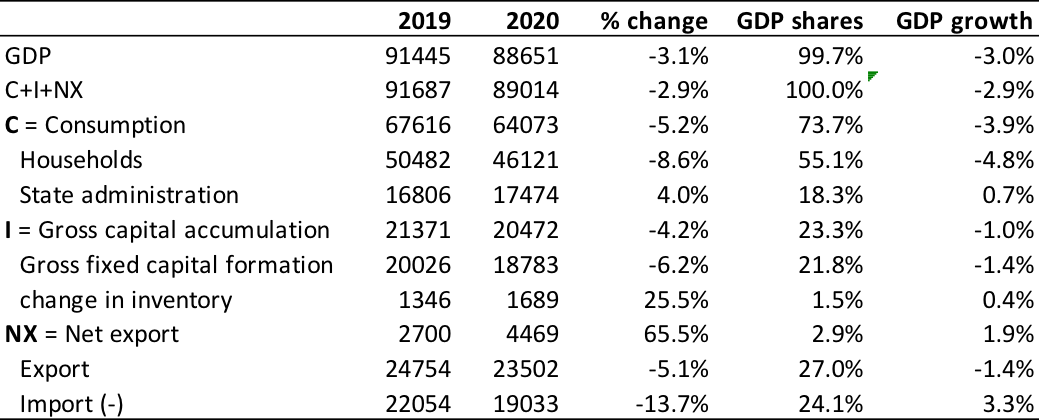
Source: Author’s calculations based on data from Rosstat
In short, private consumption fell by close to 9 percent in 2020 compared to 2019; government consumption increased by 4 percent; gross fixed capital formation declined by 6 percent while inventories increased by 26 percent; exports lost 5 percent, but imports went down by 14 so that net exports showed an increase of 65 percent! To calculate the impact these changes have on aggregate GDP growth, we need to multiply with the share of GDP for a component to arrive at the impact on GDP growth in the final column of Table 1.
Although there are some issues to resolve with both government consumption and inventory buildup, to understand real GDP growth in 2020, it is crucial to understand what happened to exports and imports in real GDP data. First of all, how does this data compare with the balance of payments data that measures exports and imports in dollar terms or the data that show the value of exports of oil, gas, and related products? Table 2 makes it clear that the numbers do not compare at all! Again, this is due to real GDP numbers being based on changes in volumes rather than values while the trade date reports values in dollars (that can be translated to rubles by using the market exchange rate).
In the real GDP statistics, net exports show growth of 66 percent in 2020, compared to declines of 37 to 44 percent if merchandise trade data is used. Going into more detail, real GDP data has exports declining by 5 percent, while other indicators fall by between 11 and 37 percent. It is similar with imports (that enter the GDP calculation with a negative sign); the import decline recorded in real GDP is 14 percent, while trade data suggest a 6 percent decline in dollar terms but an increase of 7 percent in nominal ruble terms.
Table 2. Trade statistics
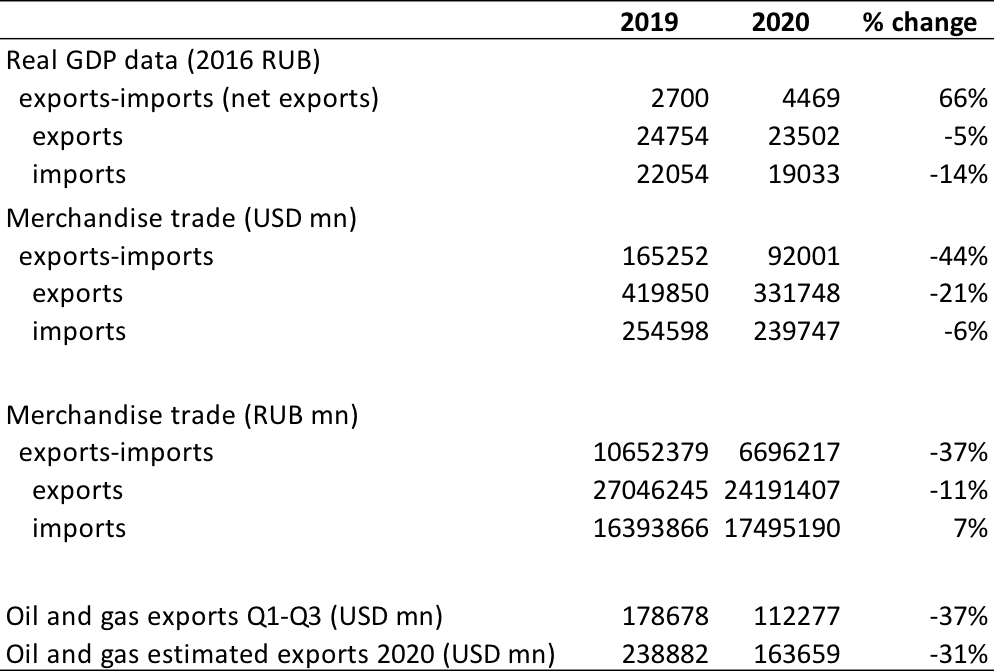
Source: Author’s calculations based on Rosstat, Central Bank of Russia and BOFIT
What would it mean if we use some of these alternative growth rates for exports and imports (while keeping other components in line with official statistics) to calculate aggregate GDP growth in 2020? The rationale for keeping other components unchanged is that this provides a first-round effect of changing trade numbers on real GDP growth.
To make this calculation, the GDP shares of exports and imports (or net exports) in 2019 are needed. Table 1 shows that these numbers are 27 and 24 percent (or a net 3 percent) of total GDP. Multiplying the share of a GDP component with its growth rate gives the contribution of the component to overall GDP growth. The calculations based on different trade data are shown in Table 3. The last line of the table is what GDP growth would have been with these alternative trade data. Note that the real GDP growth number is -2.9 percent when we use the individual components of GDP decomposition (rather than the official headline number -3.1 real GDP growth when using aggregate GDP) so this is shown here to make the table consistent with the alternative calculations. In the last column of Table 3, oil and gas exports are assumed to make up for half of exports and this number disregards changes in other exports or imports to isolate the effect of changes in the value of oil and gas exports from other changes.
The summary of this exercise is that with more meaningful trade data used in calculating GDP growth, Russia would have recorded a decline of around 9 percent rather than 3 percent. This is of course a partial analysis focusing on the trade part of real GDP since this effect is very striking. Other components of the calculation may also have issues that need to be adjusted to arrive at a more realistic growth number. Still, even the current estimate is not unrealistic. For example, household consumption fell by around 9 percent, which would be consistent with a GDP decline of 9 percent that is not recovered in the future in a permanent income model.
Table 3. GDP growth contributions from alternative trade data
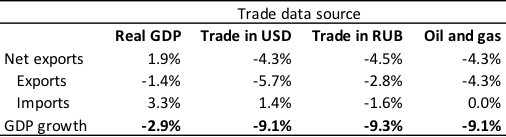
Source: Author’s calculations based on U.S. Energy Information Administration and Rosstat
Conclusions
Real GDP growth numbers are important to understand economic developments in a country and provide the foundation for many types of economic decisions. The numbers are also used to compare the economic performance of different countries and evaluate policy responses in the COVID-19 pandemic we are currently part of.
The problem with Russia’s reported growth of minus 3 percent is not that the real GDP calculation is wrong per se, but it is clearly the wrong metrics to use for understanding how incomes and purchasing powers of Russian households, companies, and the government changed in 2020. If we instead use trade data that better reflect plummeting oil prices in international markets, alternative estimates of Russia’s real growth show a GDP decline of (at least) 9 percent. This is a three times larger drop than the official number of minus 3 percent. This is important to keep in mind when Russia’s economic performance in the pandemic is compared with other countries or while discussing the economic realities of people living in Russia.
References
- Becker, Torbjörn, 2016a. “Russia’s Oil Dependence and the EU”, SITE Working paper 38.
- Becker, Torbjörn, 2016b. “Russia and Oil — Out of Control”, FREE policy brief.
- BOFIT, 2021, Weekly report 7 on Russia.
- Central Bank of Russia, 2021, data on exchange rates.
- ECDC, 2021, data on covid-19 infections and deaths.
- IMF, 2021, World Economic Outlook update, January.
- Roststat, 2021, Russia GDP data.
- U.S. Energy Information Administration, 2021, data on oil prices.
Disclaimer: Opinions expressed in policy briefs and other publications are those of the authors; they do not necessarily reflect those of SITE, the FREE Network and its research institutes.