Women in Finance Data

A Monitoring Tool
It is a well-known fact that the proportion of women varies widely between different professions. Women’s careers differ from men’s for many reasons, such as preferences, networks, norms, children, and discrimination. The share of women also varies between different areas within academia and even within the field of economics. Unfortunately, financial economics seems to be one of the subfields that attracts the least women, see e.g. Adams and Xu (2022), Lundberg and Stearns (2019), and Friebel, Fuchs-Schündeln, and Weinberger (2021).
To increase the knowledge about the representation of female researchers in finance, we have gathered information from leading research institutions by collecting data that are publicly available on the institutions' websites. Our objective is to facilitate fact-finding and induce action by publishing reliable data.
This website draws exclusively on previous work by Guido Friebel, Alisa Weinberger, and Sascha Wilhelm at Goethe University in Frankfurt. They have developed a web-scraping tool that identifies individuals listed on their employers’ websites and records the position description and name titles of these individuals. Gender is identified through first names and a gender identification software analyzing pictures. The technology is explained in detail in Friebel and Wilhelm (2019), and their work is presented on the Women in European Economics website.
The Data
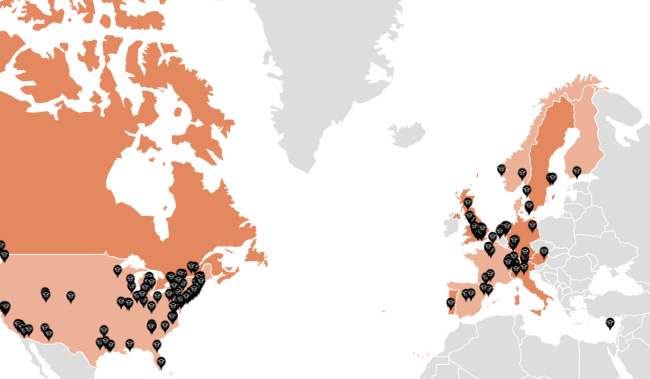
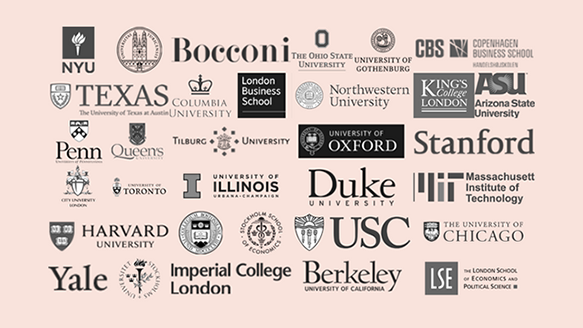
Our dataset covers only researchers in financial economics. We collect information from the global top 100 and European top 50 research institutions according to the UT Dallas Business School Rankings based on publications in the JF, JFE, and RFS in 2018–2020. The sample covers universities and business schools from 20 countries. Researchers are included in the sample if they belong to a finance department, finance research area/group/division, or if the institution otherwise provides information from which it can be retrieved whether the researchers are finance researchers.
Based on the scraped position descriptions and name titles, we map all researchers to a hierarchical level. Since every country has its own non-standardized terms for its levels, we map positions into a general hierarchy of positions: (1) Full Professor, (2) Associate Professor, (3) Assistant Professor, (4) Lecturer, (5) Research Fellow, and (6) Research Associate, see Friebel and Wilhelm (2019) for details.
We have done our best to assure the quality of the data, not only by manual checks, but also by asking the people responsible for the respective institution to verify the information we collected. Despite this, we cannot completely rule out that there are errors for individual institutions. Corrections or other input are very welcome.
We present our data on the country level, institutional level, and hierarchical level. No personal data are made available on this website.
Liability
The data on this website is managed by the Swedish House of Finance at the Stockholm School of Economics. No external parties are liable for the data.
The data may not be used for any purpose other than statistical analysis. Use of this data to learn the identity of any person is prohibited.
Read about compliance with the GDPR here.
Acknowledgements
First, we would like to thank Renée Adams at Oxford University for coming up with the idea to create this website. We would also like to thank all our colleagues for encouraging comments during the data collection process, and we are very grateful for having the opportunity to use the infrastructure developed by our colleagues at Goethe University. Finally, we would like to extend a special thank you to Alisa Weinberger for excellent project management. Without Alisa, this dataset would not have existed.
Gender distribution among researchers in financial economics
- Women (1326)
- Men (4583)
Summary Statistics
References
Adams, R.B. and J. Xu (2022)“The Inequality of Finance,” available at SSRN.
Friebel, G., N. Fuchs-Schündeln, and A. Weinberger (2021)“Statusbericht zum Frauenanteil in der Volkswirtschaftslehre an deutschen Universitäten,” Perspektiven der Wirtschaftspolitik 22 (2), 142-155
Friebel, G. and S. Wilhelm (2019)“The Women in European Economics Monitoring Tool: Technical Description,” Working Paper, available at https://women-economics.com.
Lundberg, S. and J. Stearns (2019)“Women in Economics: Stalled Progress,” Journal of Economic Perspectives, 33, 3–22
SHoF Women in Finance Data Description 2023
Please check the AFFECT database, and consider adding yourself to the list of female researchers around the world.

Download the SHoF Women in Finance Data
Countries
Gender distribution across countries
Institutions
Gender distribution across institutions
-
1.
Kings College London
41.1% -
2.
University of British Columbia
40.9% -
3.
University of Turin
39.1% -
4.
University of Edinburgh
38.8% -
5.
University of New South Wales (UNSW)
38.7% -
6.
Toulouse School of Management (TSM)
37.5% -
7.
University College London
35.3% -
8.
University of Geneva
34.3% -
9.
University of California at Irvine
33.3% -
9.
Georgia Institute of Technology
33.3% -
11.
London Business School (LBS)
32.6% -
12.
Monash University
32.5% -
13.
ESSEC
32.3% -
14.
London School of Economics and Political Science
32.1% -
14.
University of Mannheim
32.1% -
16.
University of Miami
32.0% -
17.
University of Melbourne
31.7% -
18.
Lancaster University
30.3% -
19.
University of Utah
30.2% -
20.
University of Zurich
30.0% -
21.
University of Illinois at Chicago
29.6% -
22.
National University of Singapore (NUS)
29.5% -
23.
City University London
29.4% -
23.
Stockholm University
29.4% -
25.
University of Southern California
29.0% -
26.
Imperial College London
28.9% -
26.
Hong Kong Polytechnic University
28.9% -
28.
University of Amsterdam
28.6% -
28.
Toulouse School of Economics (TSE)
28.6% -
30.
McGill University
28.2% -
31.
University of Toronto
28.0% -
31.
Carnegie Mellon University
28.0% -
33.
Indian School of Business
27.8% -
34.
University of Texas at Dallas
27.0% -
35.
Stockholm School of Economics (SSE)
26.9% -
36.
University of California at Los Angeles
26.7% -
37.
Ohio State University
26.5% -
37.
University of North Carolina at Chapel Hill
26.5% -
37.
University of Colorado at Boulder
26.5% -
40.
Tulane University
26.3% -
40.
Universidad Carlos III de Madrid (UC3M)
26.3% -
42.
Pennsylvania State University at University Park
26.2% -
43.
Drexel University
26.1% -
44.
University of Pittsburgh
25.9% -
45.
University of Missouri
25.8% -
46.
University of Minnesota at Twin Cities
25.6% -
47.
University of Warwick
25.0% -
47.
NOVA University Lisbon
25.0% -
47.
Boston University
25.0% -
47.
Temple University
25.0% -
47.
State University of New York (SUNY) at Buffalo
25.0% -
47.
Tsinghua University
25.0% -
53.
Columbia University
24.3% -
54.
BI Norwegian Business School
24.2% -
54.
Texas A&M University at College Station
24.2% -
56.
Bocconi University
24.1% -
56.
University of South Carolina
24.1% -
58.
Emory University
23.3% -
59.
University of Vienna
23.1% -
60.
University of Lausanne
22.7% -
61.
University of Manchester
22.4% -
61.
Frankfurt School of Finance and Management
22.4% -
63.
Cornell University
22.2% -
64.
City University of New York (CUNY)
21.9% -
65.
University of Washington at Seattle
21.8% -
66.
Vrije Universiteit Amsterdam
21.5% -
66.
University of Illinois at Urbana-Champaign
21.5% -
68.
Washington University at St. Louis
21.2% -
68.
University of Rochester
21.2% -
70.
Norwegian School of Economics (NHH)
20.9% -
71.
University of Gothenburg
20.8% -
71.
Massachusetts Institute of Technology
20.8% -
73.
Rice University
20.5% -
74.
Technical University of Munich (TUM)
20.0% -
74.
Nanyang Technological University
20.0% -
74.
Harvard University
20.0% -
74.
Boston College
20.0% -
74.
Georgia State University
20.0% -
79.
University of Pennsylvania
19.8% -
80.
Universita della Svizzera Italiana, Lugano
19.4% -
81.
Erasmus University
19.3% -
82.
Indiana University at Bloomington
19.2% -
82.
University of Florida
19.2% -
82.
Purdue University
19.2% -
85.
Humboldt University at Berlin
19.0% -
86.
University of Notre Dame
18.4% -
86.
University of Maryland at College Park
18.4% -
86.
Copenhagen Business School
18.4% -
89.
Northwestern University
18.3% -
90.
Swiss Federal Institute of Technology in Lausanne
18.2% -
90.
University of Arizona
18.2% -
92.
Aalto University
17.9% -
93.
University of Texas at Austin
17.6% -
93.
Yale University
17.6% -
95.
University of Chicago
17.4% -
96.
University of Houston
17.2% -
97.
University of California at Berkeley
17.1% -
98.
Duke University
17.0% -
99.
University of California at San Diego
16.1% -
100.
University of Innsbruck
15.8% -
101.
Tilburg University
15.6% -
101.
Stanford University
15.6% -
103.
Northeastern University
15.5% -
104.
Queen's University - Canada
15.4% -
104.
Arizona State University
15.4% -
106.
University of Michigan at Ann Arbor
15.2% -
107.
Singapore Management University
15.0% -
108.
University of Cambridge
14.8% -
109.
Hong Kong University of Science and Technology (HKUST)
14.6% -
110.
Michigan State University
14.3% -
111.
INSEAD
13.0% -
111.
Pompeu Fabra University
13.0% -
113.
IE University
12.7% -
114.
Goethe-University of Frankfurt
12.5% -
114.
Chinese University of Hong Kong (CUHK)
12.5% -
116.
University of Bern
11.8% -
117.
Georgetown University
11.4% -
118.
University of Kentucky
11.1% -
119.
Johns Hopkins University
10.7% -
119.
Peking University, Guanghua
10.7% -
121.
New York University
10.6% -
122.
Princeton University
10.5% -
123.
University of Hong Kong
10.0% -
123.
City University of Hong Kong
10.0% -
125.
University of Virginia
9.5% -
126.
University of Oxford
9.1% -
127.
EDHEC
8.7% -
127.
University of Navarra
8.7% -
129.
HEC Paris
7.0% -
130.
Dartmouth College
6.2% -
131.
Brigham Young University
3.7% -
132.
University of Copenhagen
0.0% -
132.
University of Cyprus
0.0% -
1.
Toulouse School of Management (TSM)
50.0% -
1.
University of Turin
50.0% -
3.
Ohio State University
44.4% -
4.
University of California at Irvine
40.0% -
4.
University of Arizona
40.0% -
6.
Lancaster University
33.3% -
6.
University of Illinois at Chicago
33.3% -
6.
Purdue University
33.3% -
6.
Tulane University
33.3% -
6.
University of Missouri
33.3% -
11.
Indiana University at Bloomington
30.0% -
12.
Toulouse School of Economics (TSE)
28.6% -
12.
University of Mannheim
28.6% -
14.
University of Utah
27.3% -
15.
University of California at Berkeley
26.7% -
16.
University of Manchester
26.3% -
17.
University of Melbourne
25.0% -
17.
Stockholm University
25.0% -
17.
City University London
25.0% -
17.
University of Edinburgh
25.0% -
17.
University of Miami
25.0% -
17.
Temple University
25.0% -
17.
University of Vienna
25.0% -
17.
University of Geneva
25.0% -
25.
Cornell University
23.1% -
25.
University of North Carolina at Chapel Hill
23.1% -
27.
Northwestern University
22.7% -
28.
University of New South Wales (UNSW)
22.2% -
28.
Queen's University - Canada
22.2% -
28.
Georgetown University
22.2% -
28.
University of Virginia
22.2% -
32.
University of Toronto
21.1% -
33.
INSEAD
20.0% -
33.
Technical University of Munich (TUM)
20.0% -
33.
University of Michigan at Ann Arbor
20.0% -
33.
University of Minnesota at Twin Cities
20.0% -
33.
Rice University
20.0% -
33.
Drexel University
20.0% -
33.
University of Pittsburgh
20.0% -
33.
University of South Carolina
20.0% -
33.
University of Kentucky
20.0% -
33.
Northeastern University
20.0% -
33.
Universidad Carlos III de Madrid (UC3M)
20.0% -
33.
Hong Kong University of Science and Technology (HKUST)
20.0% -
45.
Pennsylvania State University at University Park
18.2% -
45.
Peking University, Guanghua
18.2% -
47.
Massachusetts Institute of Technology
17.9% -
48.
University of British Columbia
16.7% -
48.
Kings College London
16.7% -
48.
Boston College
16.7% -
48.
Emory University
16.7% -
48.
Carnegie Mellon University
16.7% -
48.
City University of New York (CUNY)
16.7% -
48.
IE University
16.7% -
48.
Tsinghua University
16.7% -
56.
University of Southern California
15.8% -
57.
Monash University
14.3% -
57.
Stockholm School of Economics (SSE)
14.3% -
57.
Columbia University
14.3% -
57.
Swiss Federal Institute of Technology in Lausanne
14.3% -
61.
Goethe-University of Frankfurt
12.5% -
61.
Yale University
12.5% -
61.
University of Washington at Seattle
12.5% -
61.
University of Colorado at Boulder
12.5% -
61.
Norwegian School of Economics (NHH)
12.5% -
61.
National University of Singapore (NUS)
12.5% -
67.
University of Pennsylvania
10.7% -
67.
Stanford University
10.7% -
69.
Princeton University
10.0% -
69.
Dartmouth College
10.0% -
69.
Texas A&M University at College Station
10.0% -
72.
University of Oxford
9.1% -
72.
Brigham Young University
9.1% -
72.
University of Navarra
9.1% -
75.
London Business School (LBS)
8.3% -
75.
University of California at Los Angeles
8.3% -
77.
Frankfurt School of Finance and Management
7.7% -
77.
University of Texas at Austin
7.7% -
79.
Harvard University
7.1% -
80.
London School of Economics and Political Science
6.7% -
80.
EDHEC
6.7% -
82.
Imperial College London
5.9% -
82.
Bocconi University
5.9% -
82.
Duke University
5.9% -
85.
New York University
5.6% -
86.
Copenhagen Business School
5.3% -
87.
McGill University
0.0% -
87.
University of Gothenburg
0.0% -
87.
University of Warwick
0.0% -
87.
University of Cambridge
0.0% -
87.
University College London
0.0% -
87.
HEC Paris
0.0% -
87.
ESSEC
0.0% -
87.
Humboldt University at Berlin
0.0% -
87.
University of Chicago
0.0% -
87.
University of Illinois at Urbana-Champaign
0.0% -
87.
Washington University at St. Louis
0.0% -
87.
Arizona State University
0.0% -
87.
University of Notre Dame
0.0% -
87.
University of Maryland at College Park
0.0% -
87.
University of Florida
0.0% -
87.
University of Houston
0.0% -
87.
Georgia Institute of Technology
0.0% -
87.
Michigan State University
0.0% -
87.
University of Texas at Dallas
0.0% -
87.
University of California at San Diego
0.0% -
87.
Boston University
0.0% -
87.
University of Rochester
0.0% -
87.
Johns Hopkins University
0.0% -
87.
Georgia State University
0.0% -
87.
State University of New York (SUNY) at Buffalo
0.0% -
87.
Pompeu Fabra University
0.0% -
87.
University of Innsbruck
0.0% -
87.
Chinese University of Hong Kong (CUHK)
0.0% -
87.
University of Hong Kong
0.0% -
87.
City University of Hong Kong
0.0% -
87.
Hong Kong Polytechnic University
0.0% -
87.
University of Lausanne
0.0% -
87.
Universita della Svizzera Italiana, Lugano
0.0% -
87.
University of Bern
0.0% -
87.
University of Zurich
0.0% -
87.
BI Norwegian Business School
0.0% -
87.
Singapore Management University
0.0% -
87.
Nanyang Technological University
0.0% -
87.
University of Copenhagen
0.0% -
87.
University of Cyprus
0.0% -
87.
Aalto University
0.0% -
87.
Indian School of Business
0.0% -
87.
Erasmus University
0.0% -
87.
Tilburg University
0.0% -
87.
University of Amsterdam
0.0% -
87.
Vrije Universiteit Amsterdam
0.0% -
87.
NOVA University Lisbon
0.0%
Hierarchical Levels
Gender distribution across hierarchical levels
Feedback and questions
In case you have questions, requests, or comments, feel free to contact:
Marieke Bos
marieke.bos@hhs.se
Göran Robertsson
goran.robertsson@hhs.se
We are looking forward to hearing from you.