The impact of rising gasoline prices on households in Sweden, Georgia, and Latvia – Is this time different?
Over the last two years, the world has experienced a global energy crisis, with surging oil, coal, and natural gas prices. For European households, this translates into higher gasoline and diesel prices at the pump as well as increased electricity and heating costs. The increase in energy related costs began in 2021, as the world economy struggled with supply chain disruptions caused by the Covid-19 pandemic, and intensified as Russia launched a full-scale invasion of Ukraine in late February 2022. In response, European governments have implemented a variety of energy tax cuts (Sgaravatti et al., 2023), with a particular focus on reducing the consumer cost of transport fuel. This policy paper aims to contextualize current transport fuel prices in Europe by addressing two related questions: Are households today paying more for gasoline and diesel than in the past? And should policymakers respond by changing transport fuel tax rates? The analysis will focus on case studies from Sweden, Georgia, and Latvia, countries that vary in economic development, energy independence, reliance on Russian oil, transport infrastructure, and transport fuel tax rates. Through this study, we aim to paint a nuanced picture of the implications of rising fuel prices on household budgets and provide policy guidance.
Record high gasoline prices, historically cheap to drive
Sweden has a long history of using excise taxes on transport fuel as a means to raise revenue for the government and to correct for environmental externalities. As early as in 1924, Sweden introduced an energy tax on gasoline. Later, in 1991, this tax was complemented by a carbon tax levied on the carbon content of transport fuels. On top of this, Sweden extended the coverage of its value-added tax (VAT) to include transport fuels in 1990. The VAT rate of 25 percent is applied to all components of the consumer price of gasoline: the production cost, producer margin, and excise taxes (energy and carbon taxes).
In May 2022, the Swedish government reduced the tax rate on transport fuels by 1.80 SEK per liter (0.16 EUR). This reduction was unprecedented. Since 1960, there have only been three instances of nominal tax rate reductions on gasoline in Sweden, each by marginal amounts in the range of 0.04 to 0.22 SEK per liter. Prior to the tax cut, the combined rate of the energy and carbon tax was 6.82 SEK per liter of gasoline. Adding the VAT that is applied on these taxes, amounting to 1.71 SEK, yields a total excise tax component of 8.53 SEK. This amount is fixed in the short run and does not vary with oil price changes.
Figure 1. Gasoline Pump Price, 2000-2023.
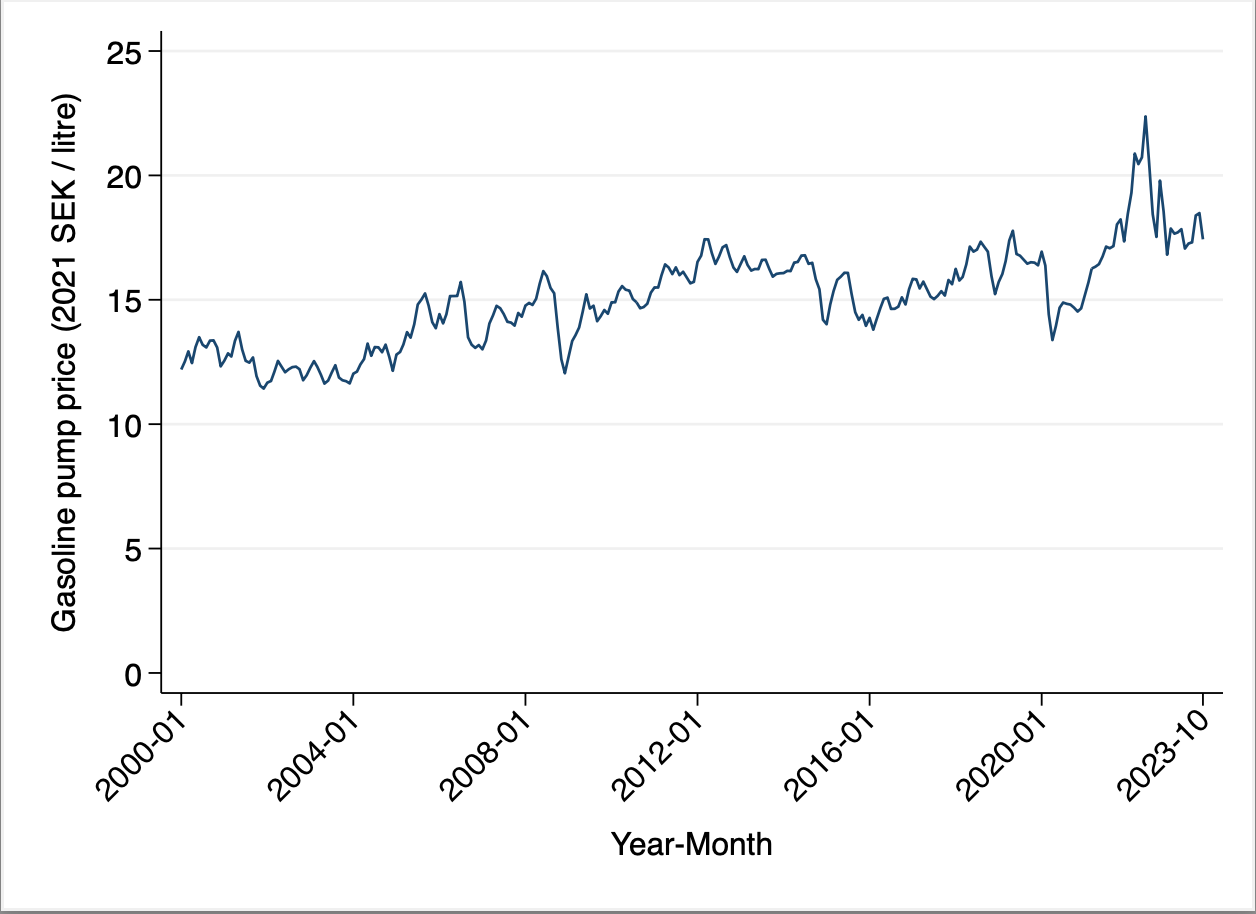
Source: Drivkraft Sverige (2023).
Figure 1 shows the monthly average real price of gasoline in Sweden from January 2000 to October 2023. The price has slowly increased over the last 20 years and has been historically high in the last year and a half. Going back even further, the price is higher today than at any point since 1960. Swedish households have thus lately been paying more for one liter of gasoline than ever before.
However, a narrow focus on the price at the pump does not take into consideration other factors that affect the cost of personal transportation for households.
First, the average fuel efficiency of the vehicle fleet has improved over time. New vehicles sold in Sweden today can drive 50 percent further on one liter of gasoline compared to new vehicles sold in 2000. Arguably, what consumers care about the most is not the cost of gasoline per se but the cost of driving a certain distance, as the utility one derives from a car is the distance one can travel. Accounting for vehicles’ fuel efficiency improvement over time, we find that even though it is still comparatively expensive to drive today, the current price level no longer constitutes a historical peak. In fact, the cost of driving 100 km was as high, or higher, in the 2000-2008 period (see Figure 2).
Figure 2. Gasoline Expenditure per 100 km.
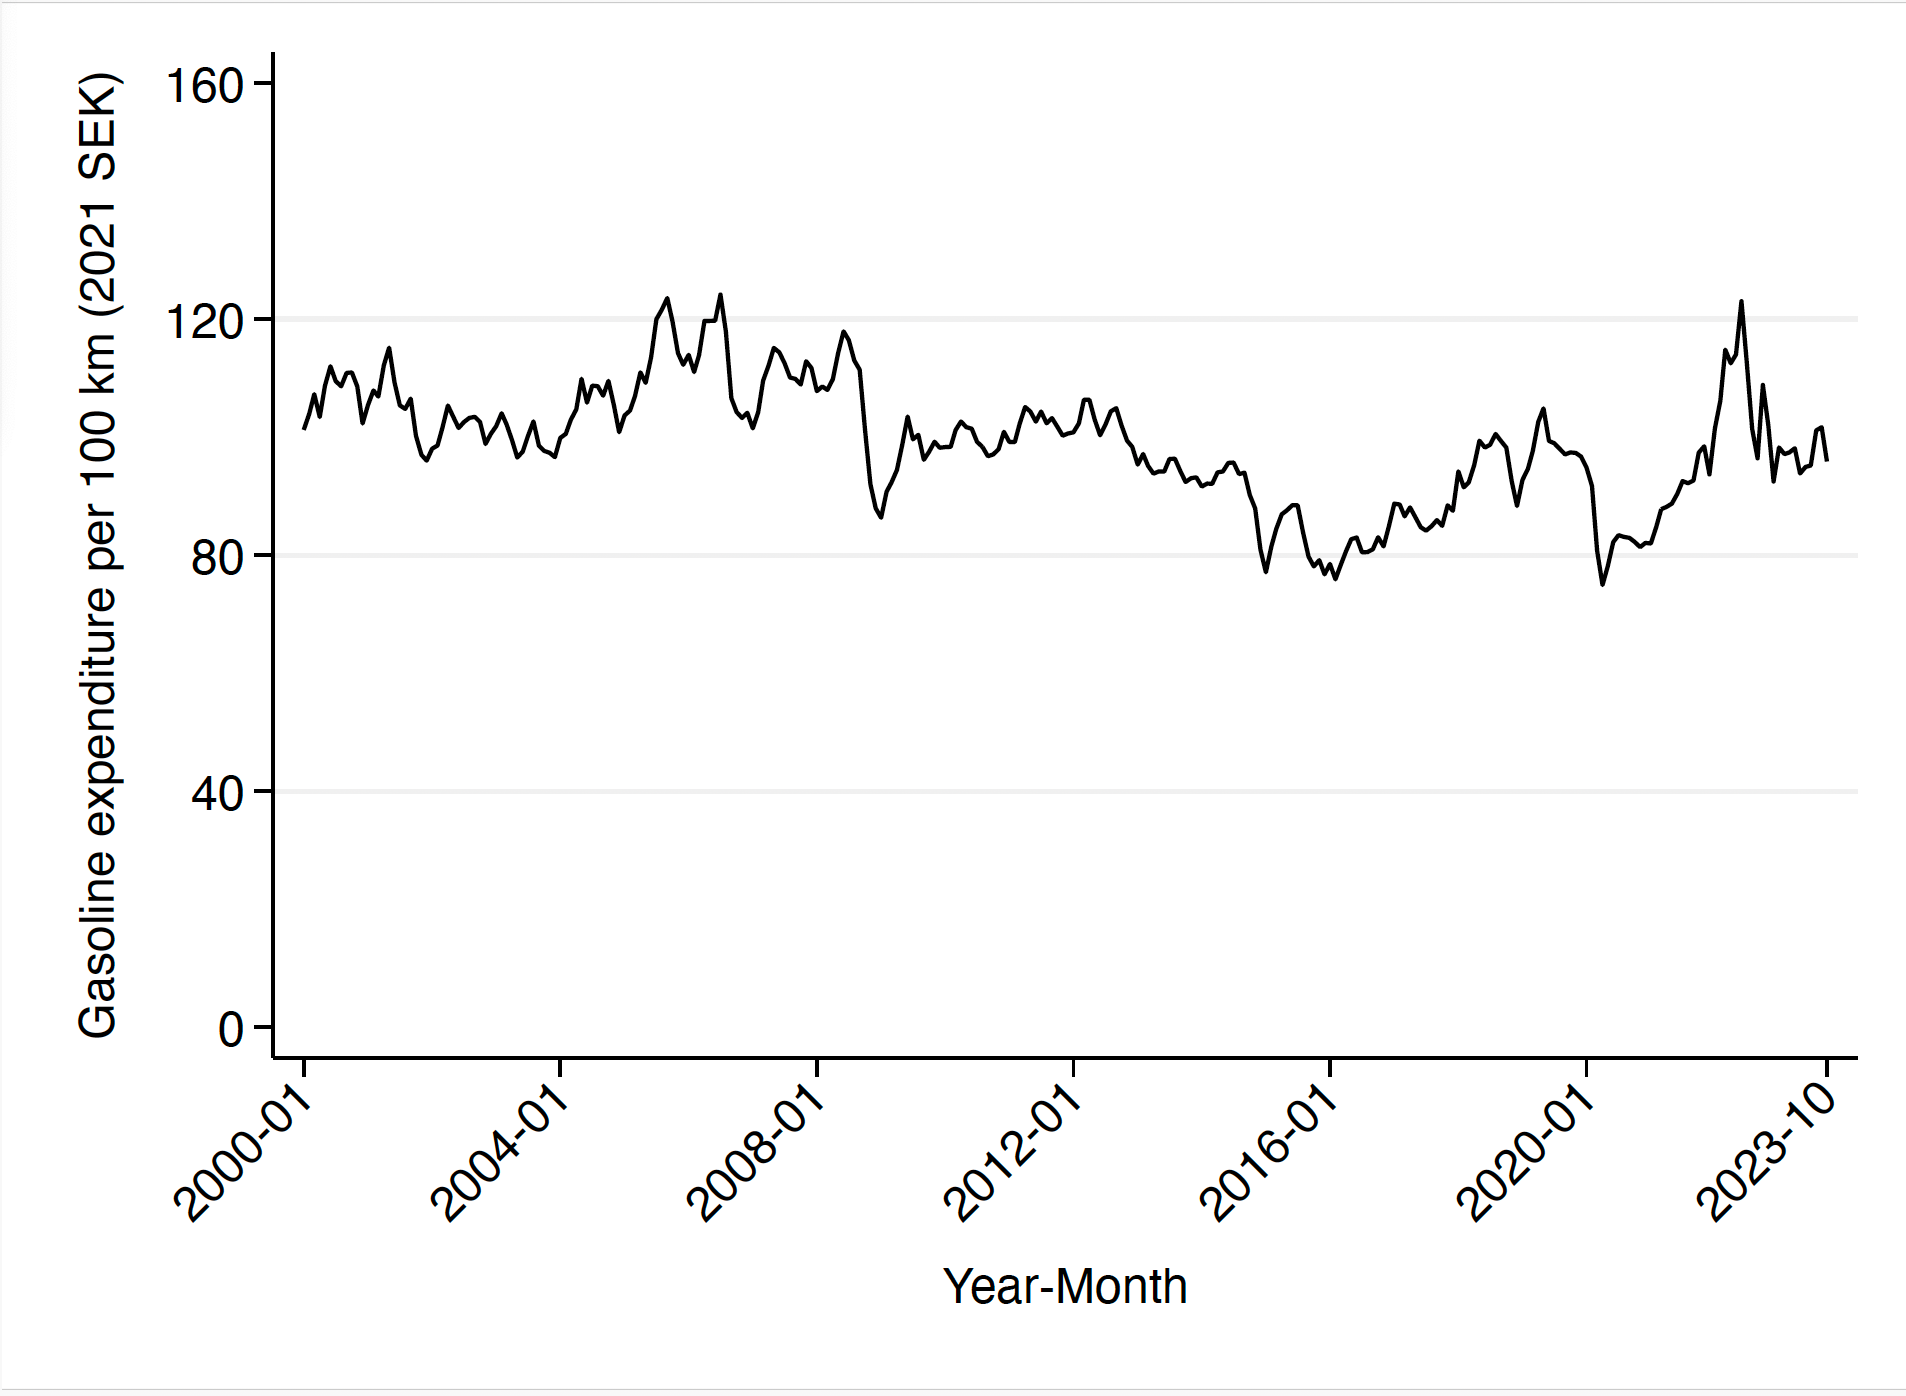
Source: Trafikverket (2023) and Drivkraft Sverige (2023).
Second, any discussion of the cost of personal transportation for households should also factor in changes in household income over time. The Swedish average real hourly wage has increased by more than thirty percent between 2000-2023. As such, the cost of driving 100 km, measured as a share of household income, has steadily declined over time. Further, this pattern is consistent across the income distribution; for instance, the cost trajectory for the bottom decile is similar to that of all wage earners (as illustrated in Figure 3). In 1991, when the carbon tax was implemented, the average household had to spend around two thirds of an hour’s wage to drive 100 km. By 2020, that same household only had to spend one third of an hour’s wage to drive the same distance. There has been an increase in the cost of driving over the last two years, but in relation to income, it is still cheaper today to drive a certain distance compared to any year before 2013.
Figure 3. Cost of Driving as a Share of Income, 1991-2023.
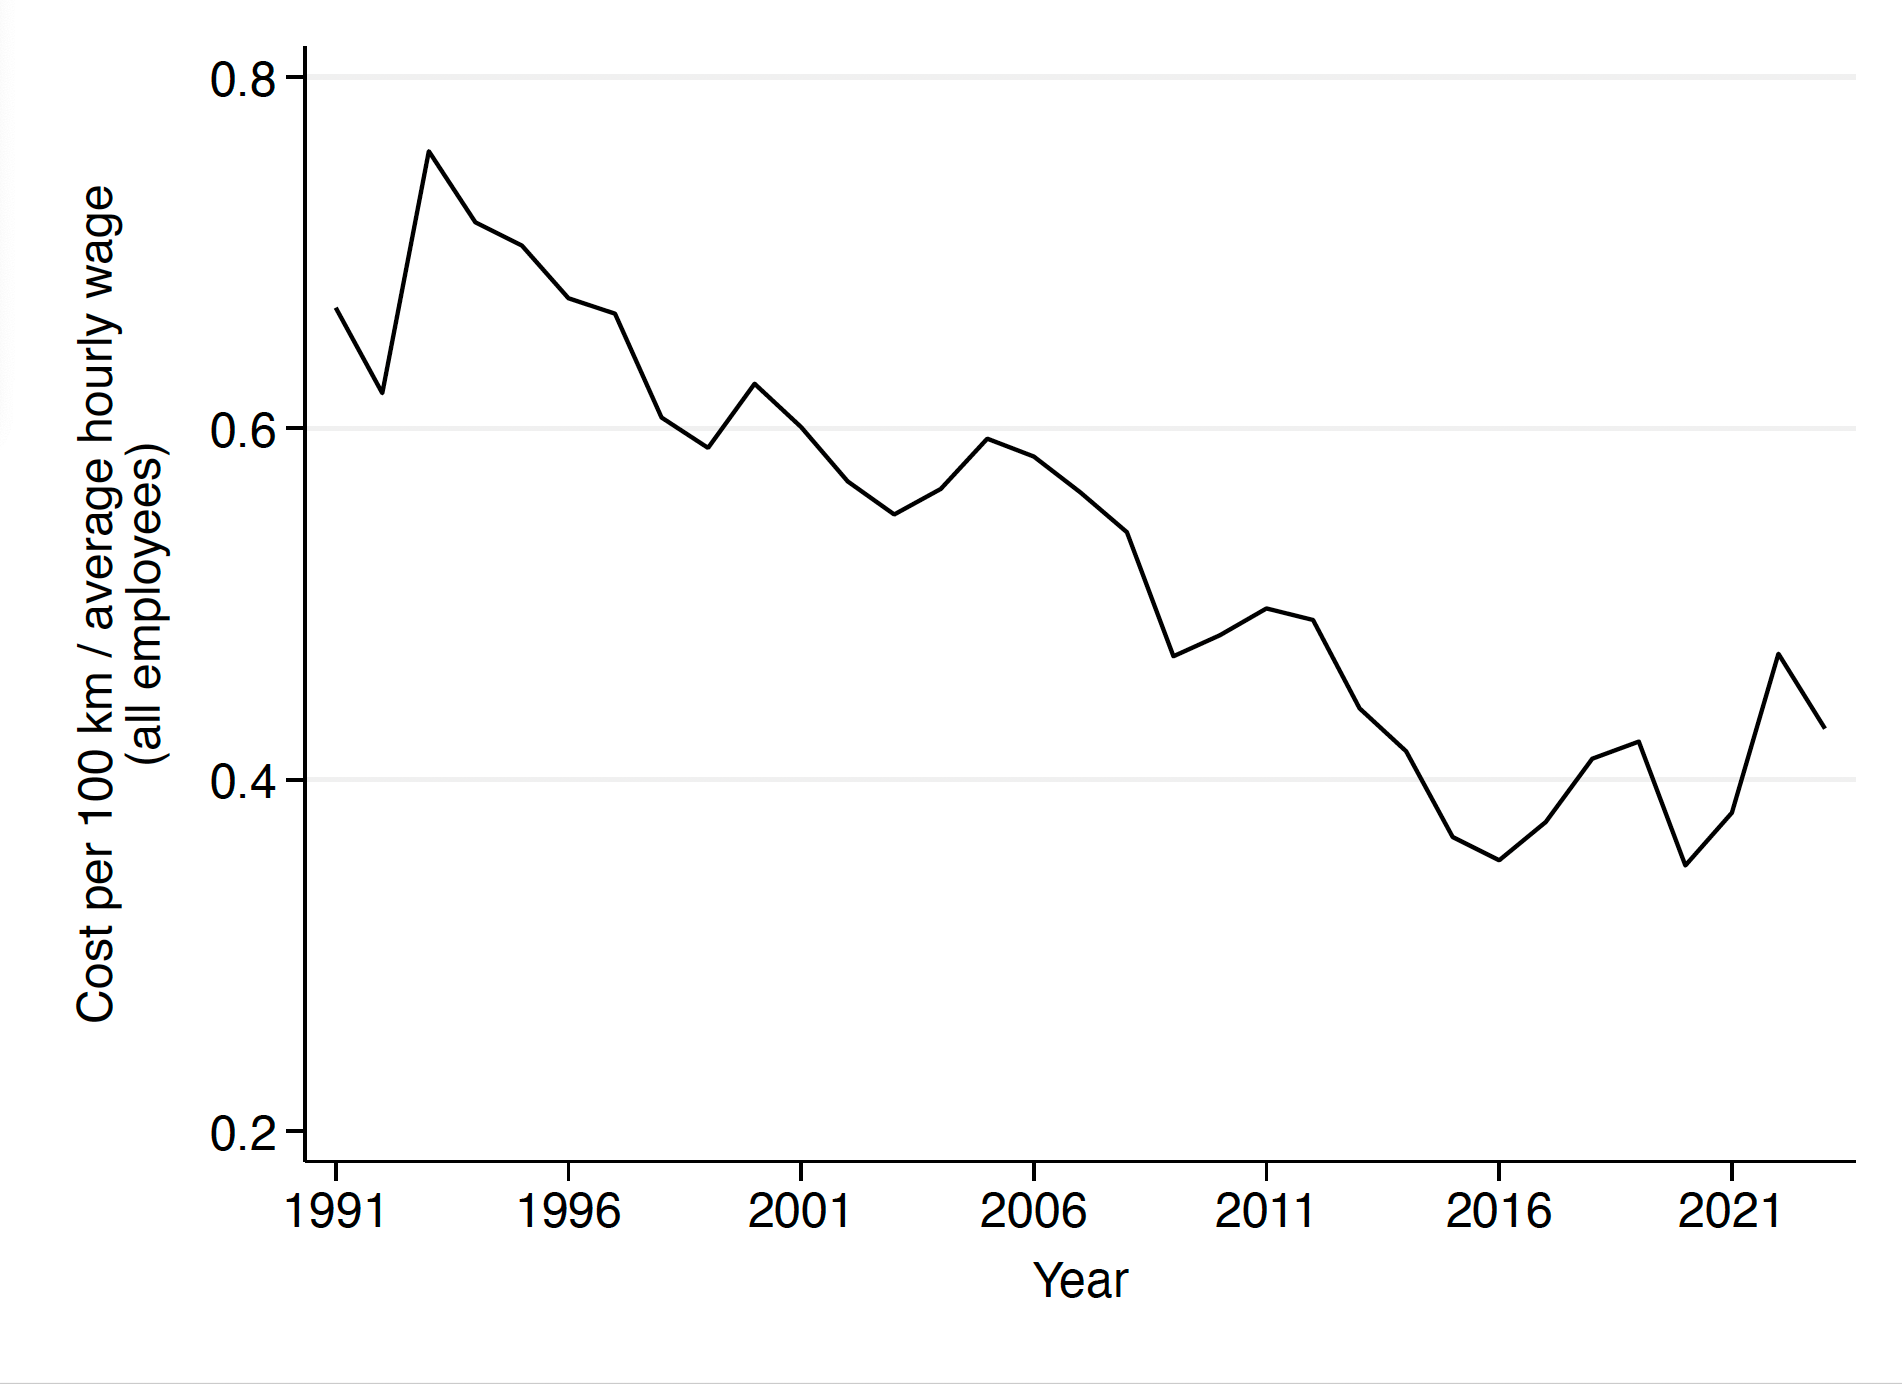
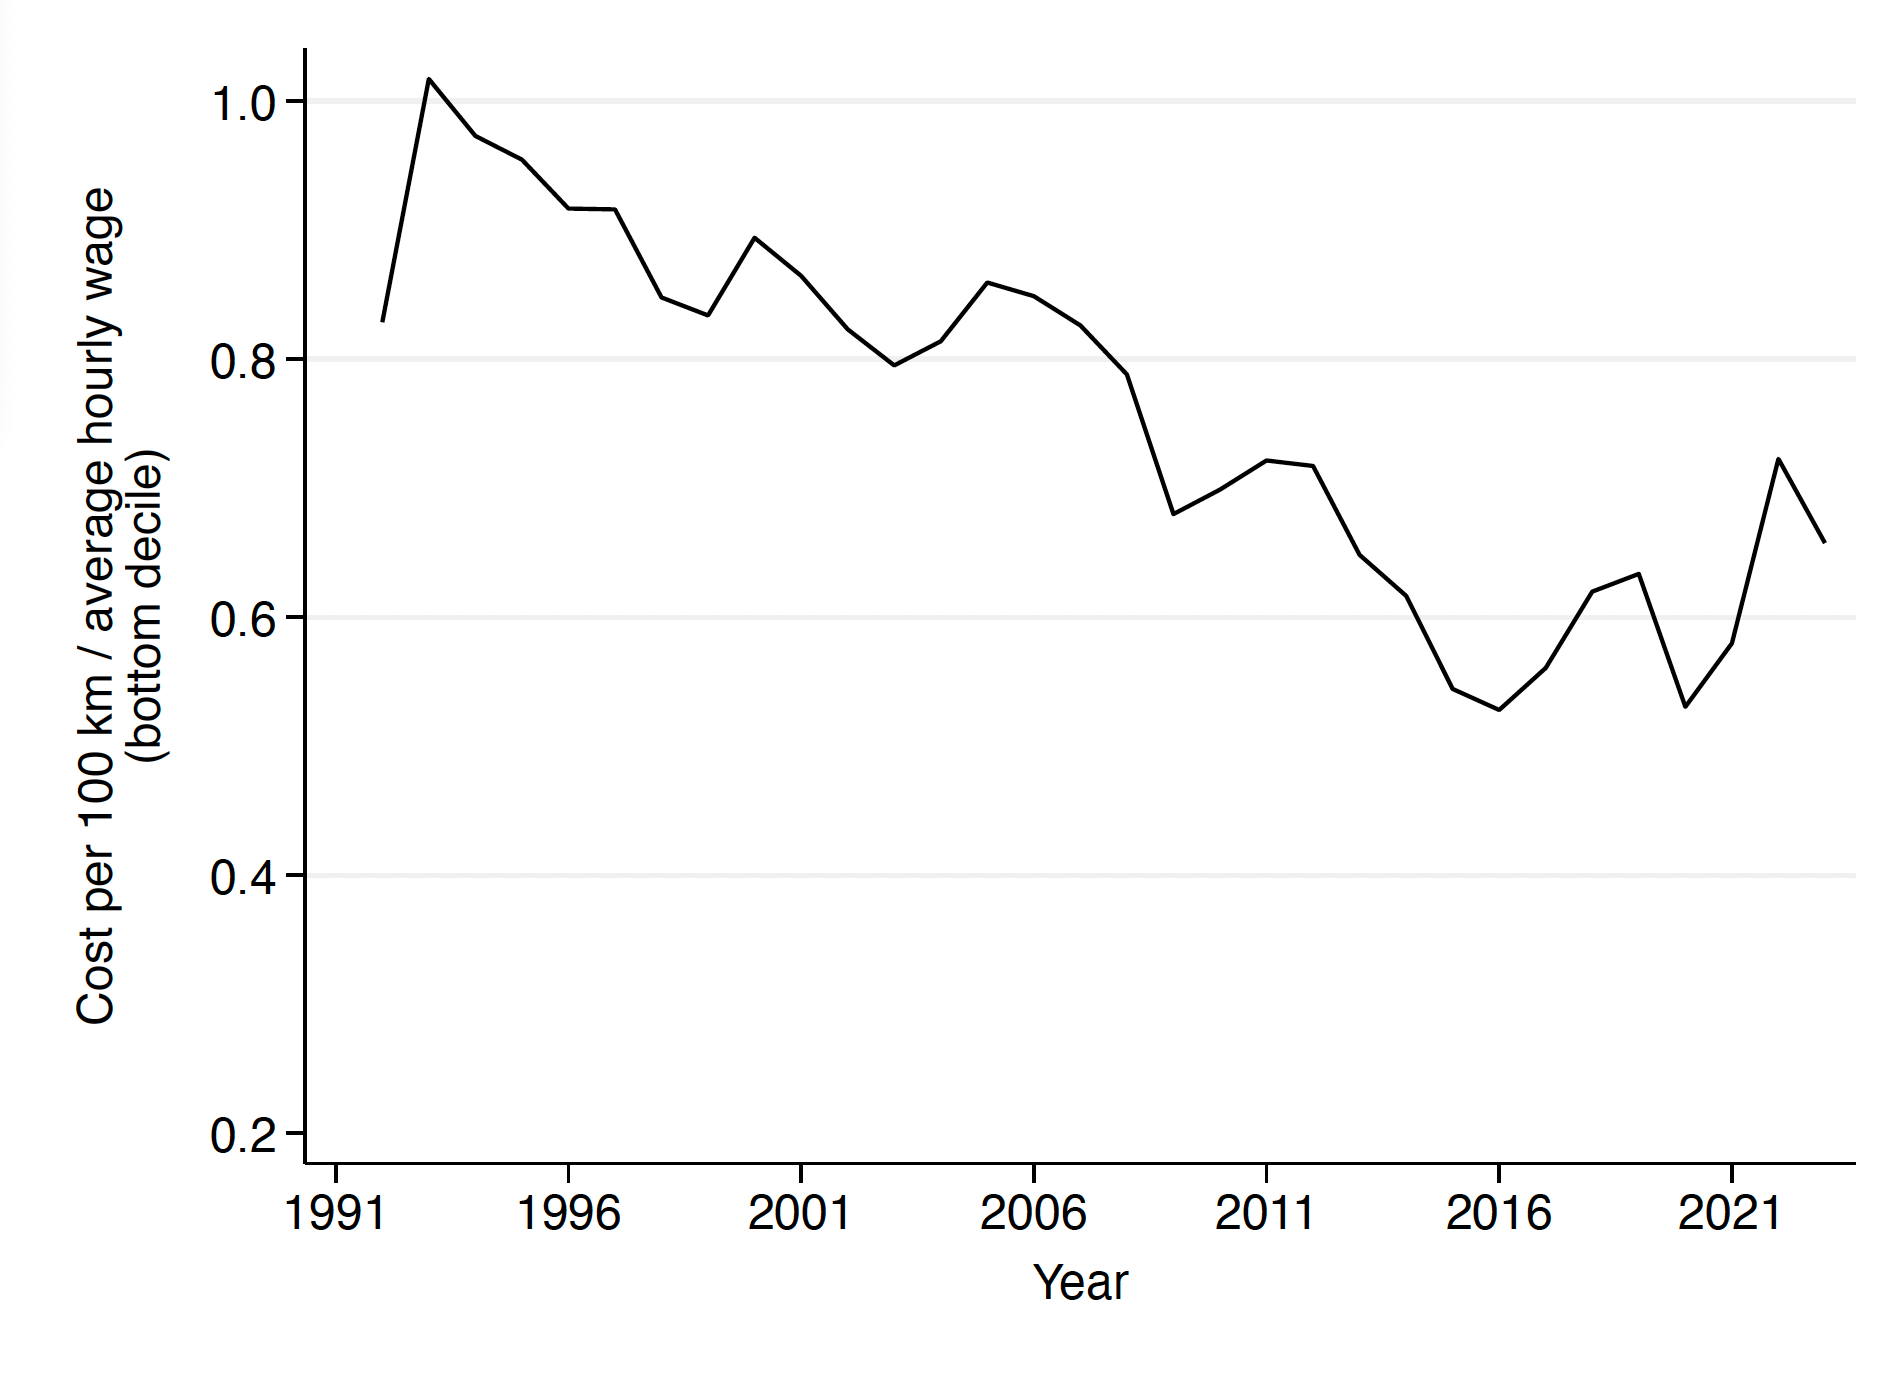
Source: Statistics Sweden (2023).
Taken all together, we see that on the expenditure side, vehicles use fuel more efficiently over time and on the income side, households earn higher wages. Based on this, we can conclude that the cost of travelling a certain distance by car is not historically high today.
Response from policymakers
It is, however, of little comfort for households to know that it was more expensive to drive their car – as a share of income – 10 or 20 years ago. We argue that what ultimately matters for households is the short run change in cost, and the speed of this change. If the cost rises too fast, households cannot adjust their expenditure pattern quickly enough and thus feel that the price increase is unaffordable. In fact, the change in the gasoline price at the pump has been unusually rapid over the last two years. Since the beginning of 2021, until the peak in June 2022, the (nominal) pump price rose by around 60 percent.
So, should policymakers respond to the rapid price increase by lowering gasoline taxes? The perhaps surprising answer is that lowering existing gasoline tax rates would be counter-productive in the medium and long run. Since excise taxes are fixed and do not vary with the oil price, they reduce the volatility of the pump price by cushioning fluctuations in the market price of crude oil. The total excise tax component including VAT constitutes more than half of the pump price in Sweden, a level that is similar across most European countries. This stands in stark contrast with the US, where excise taxes make up around 15 percent of the consumer price of gasoline. As a consequence, a doubling of the price of crude oil only increases the consumer price of gasoline in Sweden by around 35 percent, while it increases by about 80 percent in the US. Households across Sweden, Europe, and the US have adapted to the different levels of gasoline tax rates by purchasing vehicles with different levels of fuel efficiency. New light-duty vehicles sold in Europe are on average 45 percent more fuel-efficient compared to the same vehicle category sold in the US (IEA 2021). As such, US households do not necessarily benefit from lower gasoline taxation in terms of household expenditure on transport fuel. They are also more vulnerable to rapid increases in the price of crude oil. Having high gasoline tax rates thus reduces – rather than increases – the short run welfare impact on households. Hence, policymakers should resist the temptation to lower gasoline tax rates during the current energy crisis. With imposed tax cuts, households will, in the medium and long run, buy vehicles with higher fuel consumption and thus become more exposed to price surges in the future – again compelling policymakers to adjust tax rates, creating a downward spiral. Instead, alternative measures should be considered to alleviate the effects of the heavy price pressure on low-income households – for instance, revenue recycling of the carbon tax revenue and increased subsidies of public transport.
Conclusion
To reach environmental and climate goals, Sweden urgently needs to phase out the use of fossil fuels in the transport sector – Sweden’s largest source of carbon dioxide emissions. This is exactly what a gradual increase of the tax rate on gasoline and diesel would achieve. At the same time, it would benefit consumers by shielding them from the adverse effects of future oil price volatility.
The most common response from policymakers regarding fuel tax rates however goes in the opposite direction. In Sweden, the excise tax on gasoline and diesel was reduced by 1.80 SEK per liter in 2022 and the current government plans to further reduce the price by easing the biofuel mandate. Similar tax cuts have been implemented in a range of European countries. Therefore, the distinguishing factor in the current situation lies in the exceptional responses from policymakers, rather than in the gasoline costs that households are encountering.
Gasoline price swings and their consequences for Georgian consumers
The energy crisis that begun in 2021 has also made its mark on Georgia, where the operational expenses of personal vehicles, encompassing not only gasoline costs but also maintenance expenses, account for more than 8 percent of the consumer price index. The rise in gasoline prices sparked public protest and certain opposition parties proposed an excise tax cut to mitigate the gasoline price surge. In Georgia, gasoline taxes include excise taxes and VAT. Until January 1, 2017, the excise tax was 250 GEL per ton (9 cents/liter), it has since increased to 500 GEL (18 cents/liter). Despite protests and the suggested excise tax reduction, the Georgian government chose not to implement any tax cuts. Instead, it initiated consultations with major oil importers to explore potential avenues for reducing the overall prices. Following this, the Georgian National Competition Agency (GNCA) launched an inquiry into the fuel market for motor vehicles, concluding a manipulation of retail prices for gasoline existed (Georgian National Competition Agency, 2023).
The objective of this part of the policy paper is to address two interconnected questions. Firstly, are Georgian households affected by gasoline price increases? And secondly, if they are, is there a need for government intervention to mitigate the negative impact on household budgets caused by the rise in gasoline prices?
The gasoline market in Georgia
Georgia’s heavy reliance on gasoline imports is a notable aspect of the country’s energy landscape. The country satisfies 100 percent of its gasoline needs with imports and 99 percent of the fuel imported is earmarked for the road vehicle transport sector. Although Georgia sources its gasoline from a diverse group of countries, with nearly twenty nations contributing to its annual gasoline imports, the supply predominantly originates from a select few markets: Bulgaria, Romania, and Russia. In the last decade, these markets have almost yearly accounted for over 80 percent of Georgia’s total gasoline imports. Furthermore, Russia’s share has substantially increased in recent years, amounting to almost 75 percent of all gasoline imports in 2023. The primary reason behind Russia’s increased dominance in Georgia’s gasoline imports is the competitive pricing of Russian gasoline, which between January and August in 2023 was almost 50 percent cheaper than Bulgarian gasoline and 35 percent cheaper than Romanian gasoline (National Statistics Office of Georgia, 2023). Given the dominance of Russian gasoline in Georgia, the end-user (retail) prices of gasoline in Georgia, are closer to gasoline prices in Russia than EU gasoline prices (see Figure 1).
Figure 1. End-user Gasoline Prices in Georgia, Russia and the EU, 2013-2022.
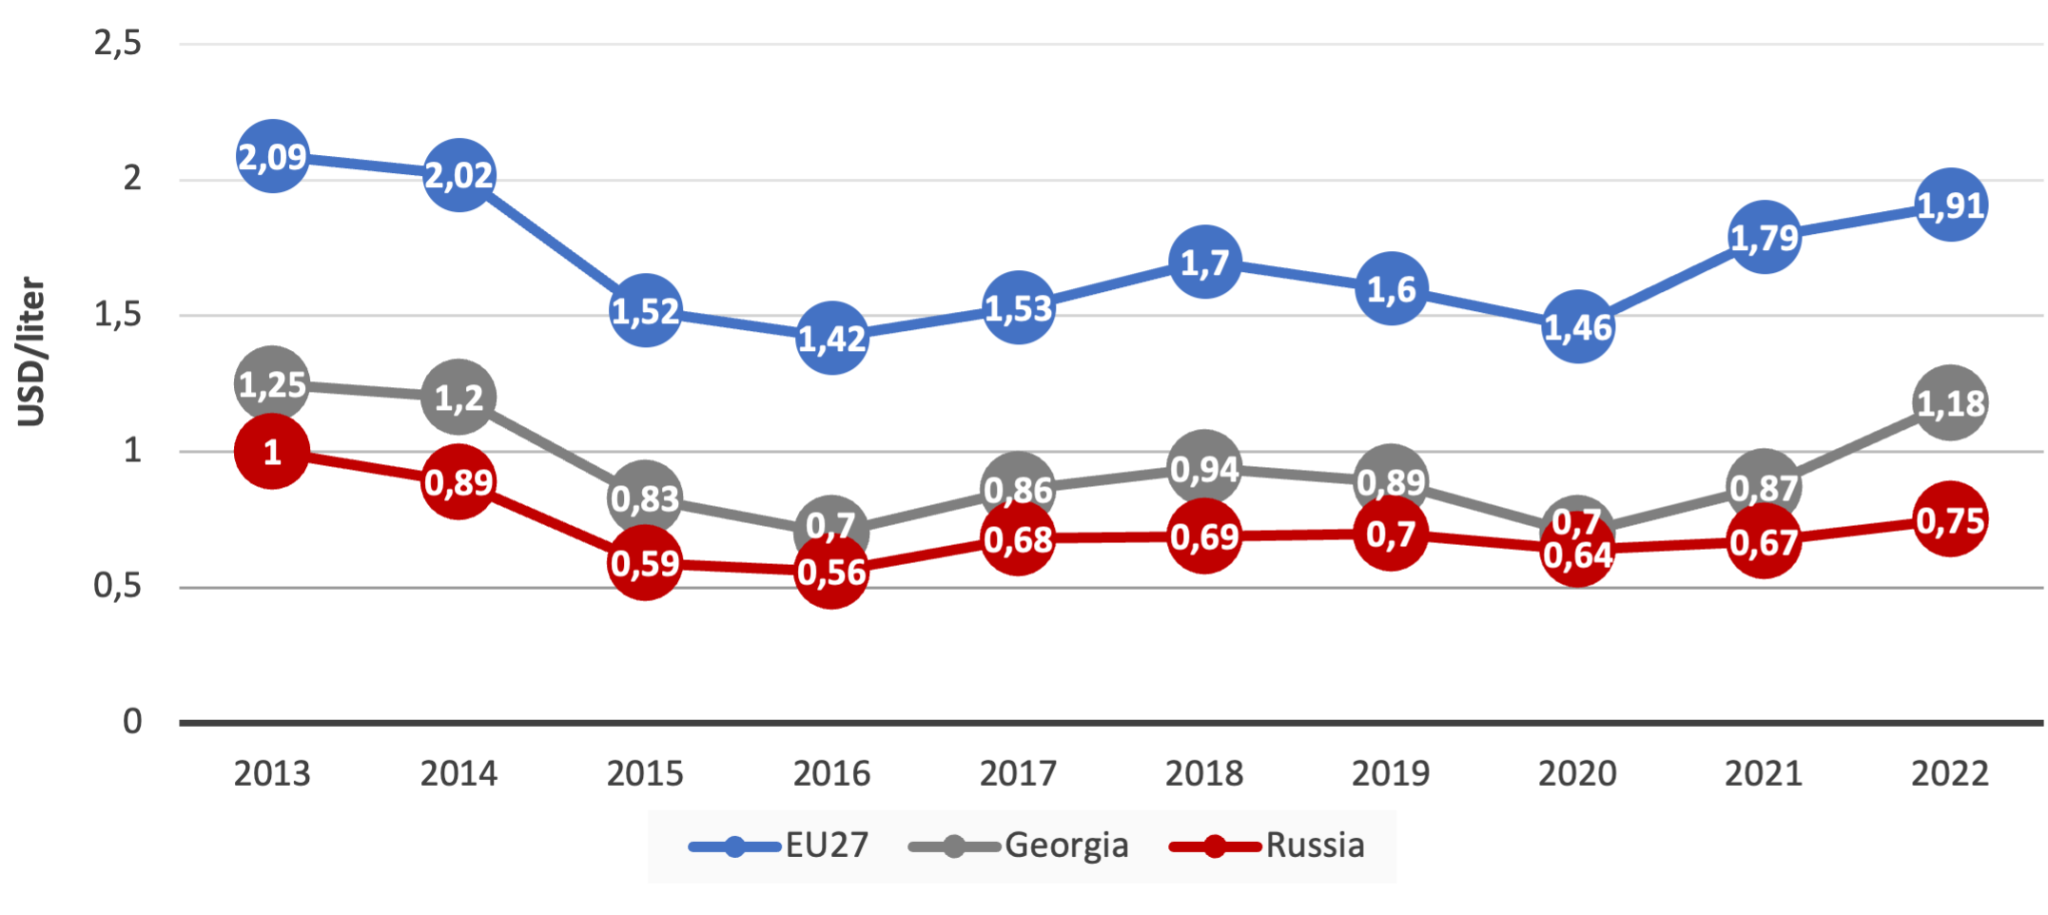
Source: International Energy Agency, 2023.
However, while the gasoline prices increased steadily in 2020-2022 in Russia, gasoline prices in Georgia increased sharply in the same period. This more closely replicated the EU price dynamics rather than the Russian one. The sharp price increase in gasoline raised concerns from the Georgian National Competition Agency (GNCA). According to the GNCA one possible reason behind the sharp increase in gasoline prices in Georgia could be anti-competitive behaviour among the five major companies within the gasoline market. Accordingly, the GNCA investigated the behaviour of major market players during the first eight months of 2022, finding violations of the Competition Law of Georgia. Although the companies had imported and were offering consumers different and significantly cheaper transport fuels compared to fuels of European origin, their retail pricing policies were identical and the differences in product costs were not properly reflected in the retail price level. GNCA claims the market players coordinated their actions, which could have led to increased gasoline prices in Georgia (National Competition Agency of Georgia. (2023).
Given that increased gasoline prices might lead to increased household expenditures for fuel, it is important to assess the potential impact of recent price developments on household’s budgets.
Exploring gasoline price impacts
Using data from the Georgian Households Incomes and Expenditures Survey (National Statistics Office of Georgia, 2023), weekly household expenditures on gasoline and corresponding weekly incomes were computed. To evaluate the potential impact of rising gasoline prices on households, the ratio of household expenditures on gasoline to household income was used. The ratios were calculated for all households, grouped in three income groups (the bottom 10 percent, the top 10 percent and those in between), over the past decade (see Figure 2).
Figure 2. Expenditure on Gasoline as Share of Income for Different Income Groups in Georgia, 2013-2022.
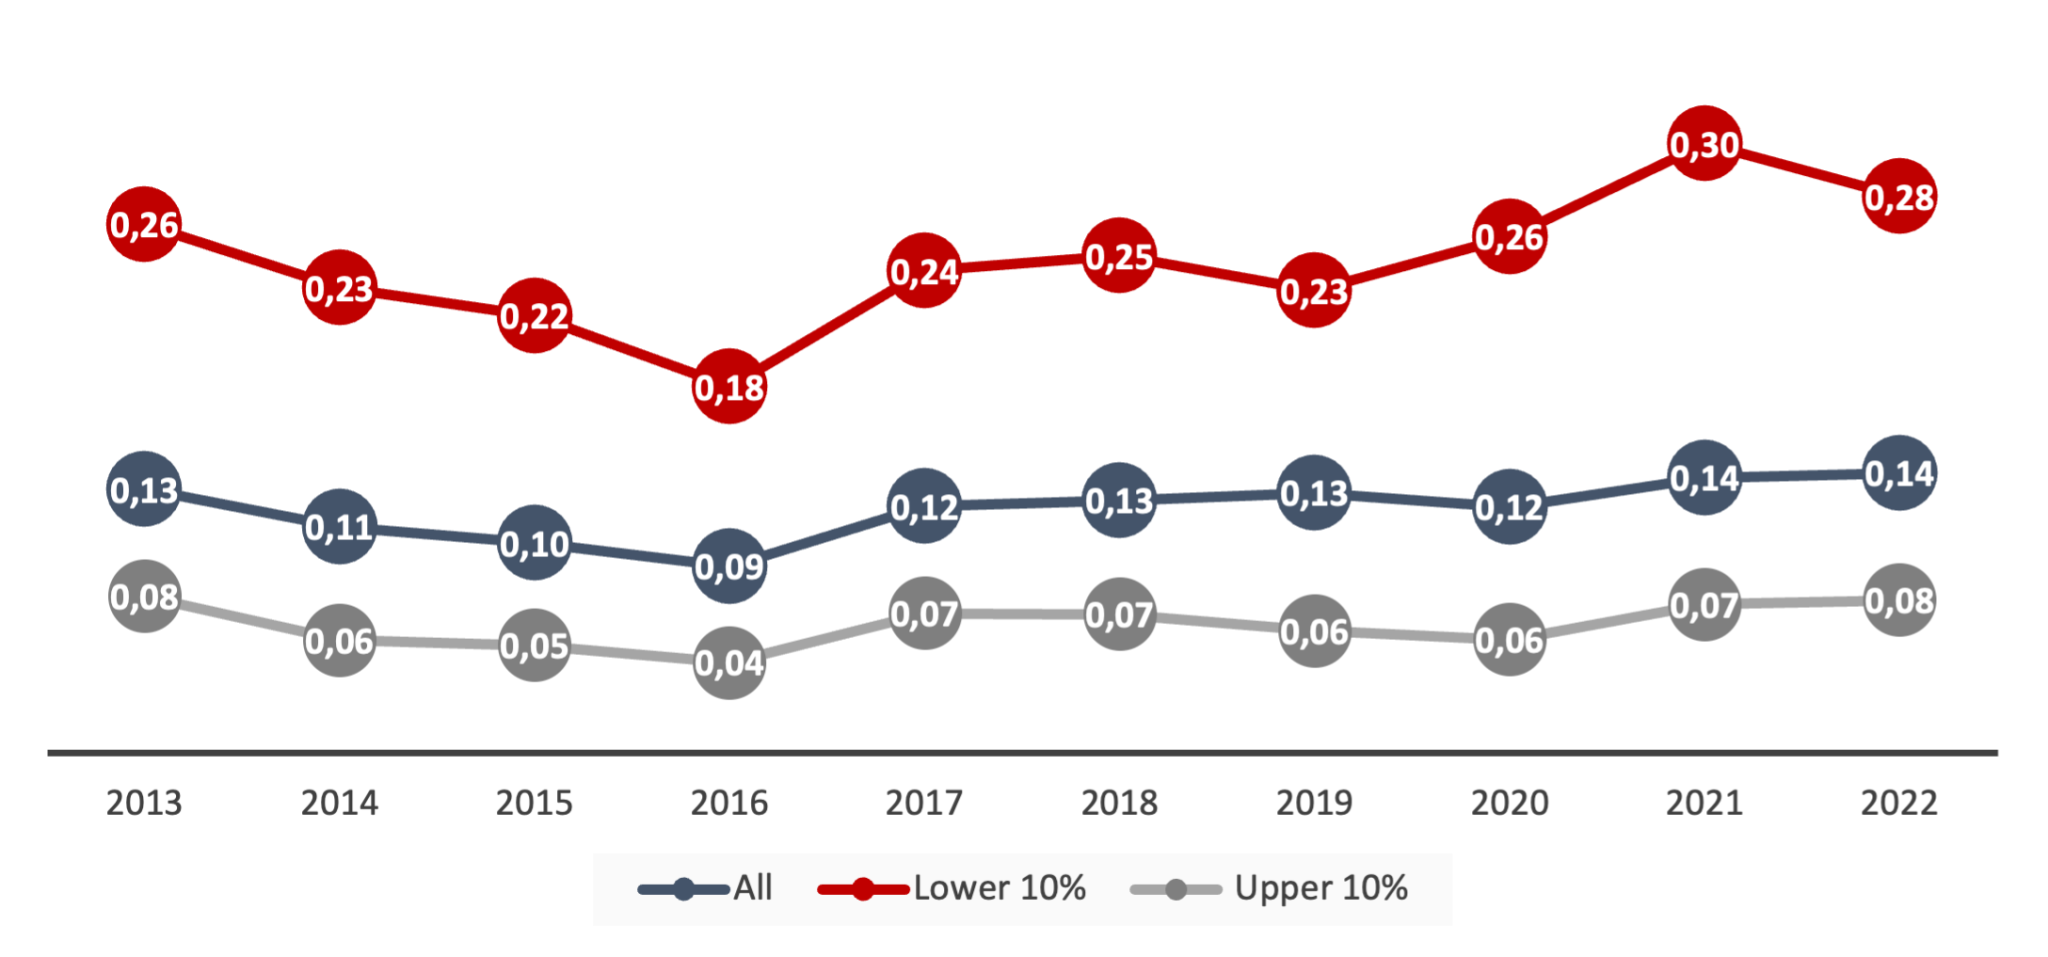
Source: National Statistics Office of Georgia, 2023.
Figure 2 shows that between 2013 and 2022, average households allocated 9-14 percent of their weekly income to gasoline purchases. There is no discernible increase in the ratio following the energy crisis in 2021-2022.
Considering the different income groups, the upper 10 percent income group experienced a slightly greater impact from the recent rise in gasoline prices (the ratio increased), compared to the overall population. For the lower income group, which experienced a rise in the proportion of fuel costs relative to total income from 2016 to 2021, the rate declined between 2021 and 2022. Despite the decline in the ratio for the lower-level income group, it is noteworthy that the share of gasoline expenditure in the household budget has consistently been high throughout the decade, compared to the overall population and the higher-level income group.
The slightly greater impact from the rise in gasoline prices for the upper 10 percent income group is driven by a 4 percent increase in nominal disposable income, paired with an 8 percent decline in the quantity of gasoline (Figure 3) in response to the 22 percent gasoline price increase. Clearly, for this income group, the increase in disposable income was not enough to offset the increase in the price of gasoline, increasing the ratio as indicated above.
For the lower 10 percent income group, there was a 23 percent increase in nominal disposable income, paired with a 9 percent decline in the quantity of purchased gasoline (Figure 3) in response to the 22 percent gasoline price increase . Thus, for this group, the increase in disposable income weakened the potential negative impact of increased prices, eventually lowering the ratio.
Figure 3. Average Gasoline Quantities Purchased, by Household Groups, per Week (In Liters) 2013-2022.
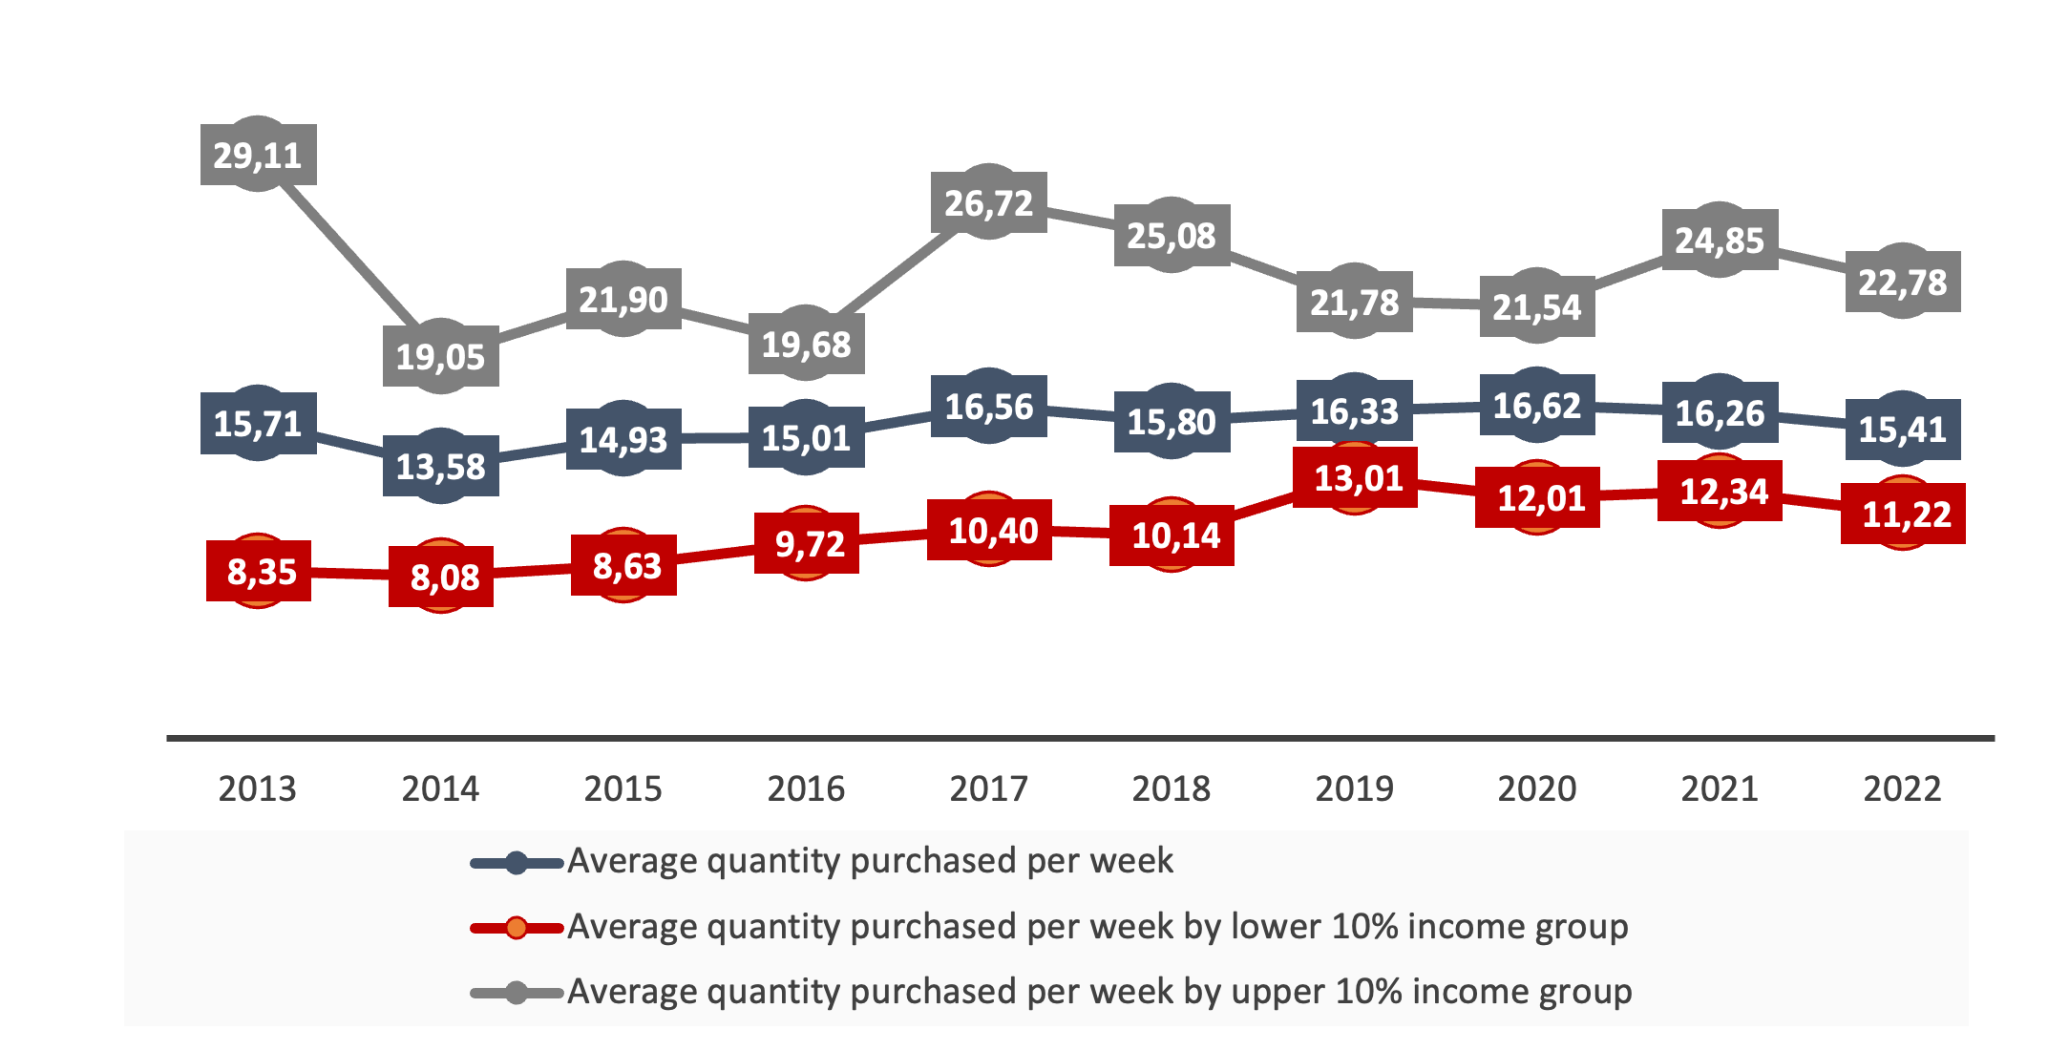
Source: National Statistics Office of Georgia, 2023.
Conclusion
The Georgian energy market is currently fully dependent on imports, predominantly from Russia. While sharp increases in petrol prices have been observed during the last 2-3 years, they do not seem to have significantly impacted Georgian households’ demand for gasoline. Noteworthy, the lack of impact from gasoline price increases on Georgian households’ budgets, as seen in the calculated ratio (depicted in Figure 2), can be explained by the significant rise in Georgia’s imports from the cheap Russian market during the energy crisis years. Additionally, according to the Household Incomes and Expenditures survey, there was in 2022 an annual increase in disposable income for households that purchased gasoline. However, the data also show that low-income households spend a high proportion of their income on gasoline.
Although increased prices did not significantly affect Georgian households, the extremely high import dependency and the lack of import markets diversification poses a threat to Georgia’s energy security and general economic stability. Economic dependency on Russia is dangerous as Russia traditionally uses economic relations as a lever for putting political pressure on independent economies. Therefore, expanding trade and deepening economic ties with Russia should be seen as risky. Additionally, the Russian economy has, due to war and sanctions, already contracted by 2.1 percent in 2022 and further declines are expected (Commersant, 2023).
Prioritizing actions such as diversifying the import market to find relatively cheap suppliers (other than Russia), closely monitoring the domestic market to ensure that competition law is not violated and market players do not abuse their power, and embracing green, energy-efficient technologies can positively affect Georgia’s energy security and positively impact sustainable development more broadly.
Fueling concerns: The true cost of transportation in Latvia
In May 2020, as the Latvian Covid-19 crisis began, Latvia’s gasoline price was 0.99 EUR per liter. By June 2022, amid the economic effects from Russia’s war on Ukraine, the price had soared to a record high 2.09 EUR per liter, sparking public and political debate on the fairness of fuel prices and potential policy actions.
While gas station prices are salient, there are several other more hidden factors that affect the real cost of transportation in Latvia. This part of the policy paper sheds light on such costs by looking at some of its key indicators. First, we consider the historical price of transport fuel in Latvia. Second, we consider the cost of fuel in relationship to average wages and the fuel type composition of the vehicle fleet in Latvia.
The price of fuel in Latvia
Latvia’s nominal retail prices for gasoline (green line) and diesel (orange line) largely mirror each other, though gasoline prices are slightly higher, in part due to a higher excise duty (see Figure 1). These local fuel prices closely follow the international oil market prices, as illustrated by the grey line representing nominal Brent oil prices per barrel.
The excise duty rate has been relatively stable in the past, demonstrating that it has not been a major factor in fuel price swings. A potential reduction to the EU required minimum excise duty level will likely have a limited effect on retail prices. Back of the envelope calculations show that lowering the diesel excise duty from the current 0.414 EUR per liter to EU’s minimum requirement of 0.33 EUR per liter could result in approximately a 5 percent drop in retail prices (currently, 1.71 EUR per liter). This at the cost of a budget income reduction of 0.6 percent, arguably a costly policy choice.
In response to recent years’ price increase, the Latvian government opted to temporarily relax environmental restrictions, making the addition of a bio component to diesel and gasoline (0.065 and 0.095 liters per 1 liter respectively) non-mandatory for fuel retailers between 1st of June 2022 until the end of 2023. The expectation was that this measure would lead to a reduction in retail prices by approximately 10 eurocents. To this date, we are unaware of any publicly available statistical analysis that verifies whether the relaxed restriction have had the anticipated effect.
Figure 1. Nominal Retail Fuel Prices and Excise Duties for Gasoline and Diesel in Latvia (in EUR/Liter), and Nominal Brent Crude Oil Prices (in EUR/Barrel), January 2005 to August 2023.
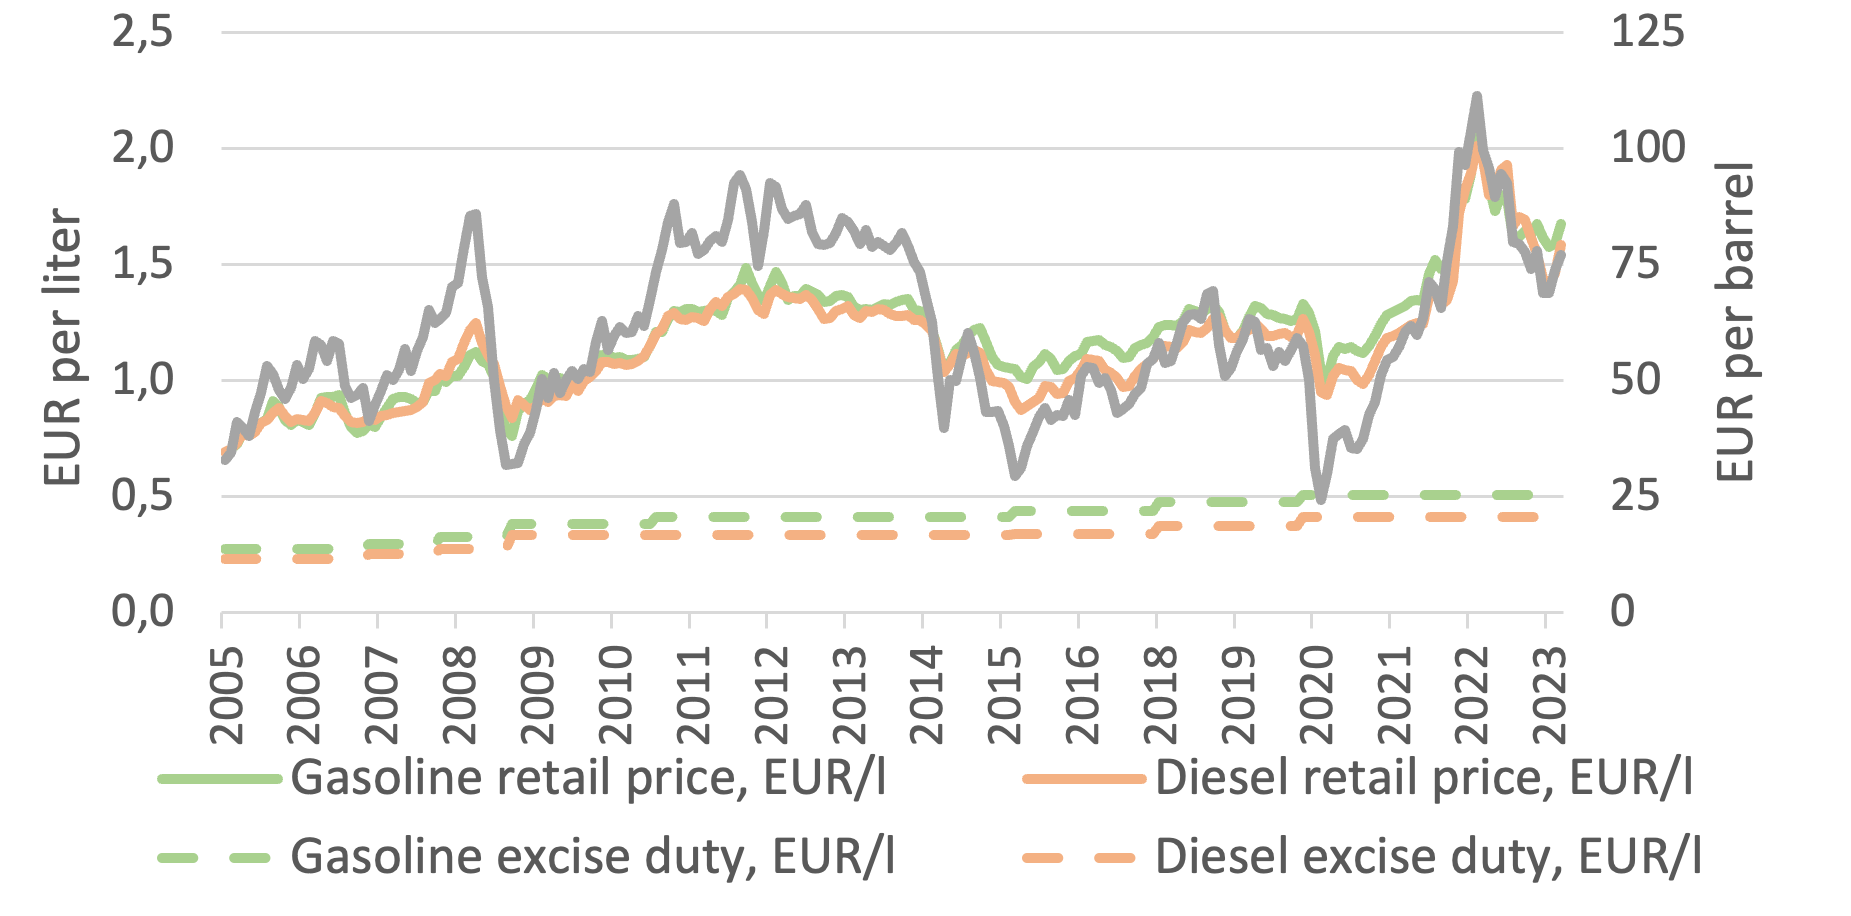
Source: The Central Statistical Bureau of Latvia, St. Louis Federal Reserve’s database, OFX Monthly Average Rates database, The Ministry of Finance of Latvia, The State Revenue Service of Latvia.
The true cost of transportation
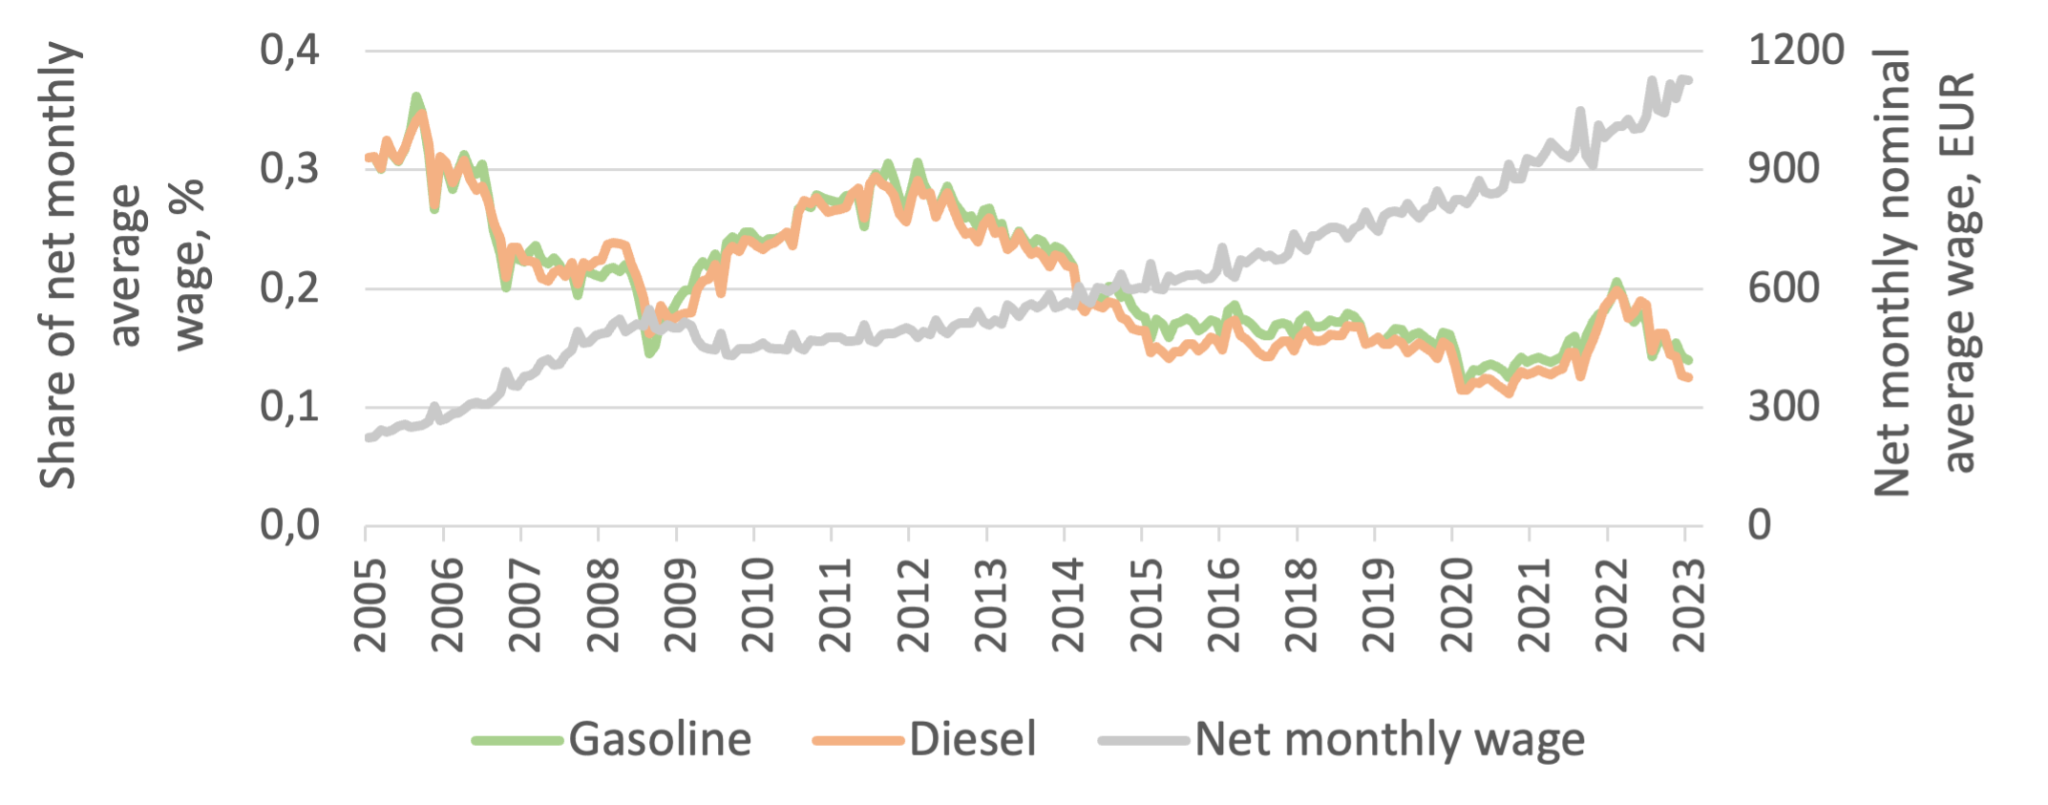
Comparing fuel retail prices to average net monthly earnings gives insight about the true cost of transportation in terms of purchasing power. Figure 2 displays the nominal net monthly average wage in Latvia from January 2005 to June 2023 (grey line). During this time period the average worker saw a five-fold nominal wage increase, from 228 EUR to 1128 EUR monthly. The real growth was two-fold, i.e., the inflation adjusted June 2023 wage, in 2005 prices, was 525 EUR.
Considering fuel’s share of the wages; one liter of gasoline amounted to 0.3 percent of an average monthly wage in 2005, as compared to 0.12 percent in 2023, with diesel displaying a similar pattern. Thus, despite recent years’ fuel price increase, the two-fold increase in purchasing power during the same time period implies that current fuel prices may not be as alarming for Latvian households as they initially appeared to be.
Figure 2. Average Nominal Monthly Net Wages in Latvia and Nominal Prices of One Liter of Gasoline and Diesel as Shares of Such Wages (in EUR), January 2005 to June 2023.
Another factor to consider is the impact of technological advancements on fuel efficiency over time. The idea is simple: due to technological improvements to combustion engines, the amount of fuel required to drive 100 kilometers has decreased over time, which translates to a lower cost for traveling additional kilometers today. An EU average indicator shows that the fuel efficiency of newly sold cars improved from 7 liters to 6 liters per 100 km, respectively, in 2005 and 2019. While we lack precise data on the average fuel efficiency of all private vehicles in Latvia, we can make an informed argument in relation to the technological advancement claim by examining proxy indicators such as the type of fuel used and the average age of vehicles.
Figure 3 shows a notable change in the fuel type composition of the vehicle fleet in Latvia. Note that the decrease in the number of cars in 2011 is mainly due to a statistical correction for unused cars. At the start of the 21st century, 92 percent of Latvian vehicles were gasoline-powered and 8 percent were diesel-powered. By 2023, these proportions had shifted to 28 percent for gasoline and 68 percent for diesel. Diesel engines are more fuel efficient, usually consuming 20-35 percent less fuel than gasoline engines when travelling the same distance. Although diesel engines are generally pricier than their gasoline counterparts, they offer a cost advantage for every kilometer driven, easing the impact of rising fuel prices. A notable drawback of diesel engines however, is their lower environmental efficiency – highlighted following the 2015 emission scandal. In part due to the scandal, the diesel vehicles growth rate have dropped over the past five years in Latvia.
Figure 3. Number of Private Vehicles by Fuel Type and the Average Age of Private Vehicles in Latvia, 2001 to 2023.
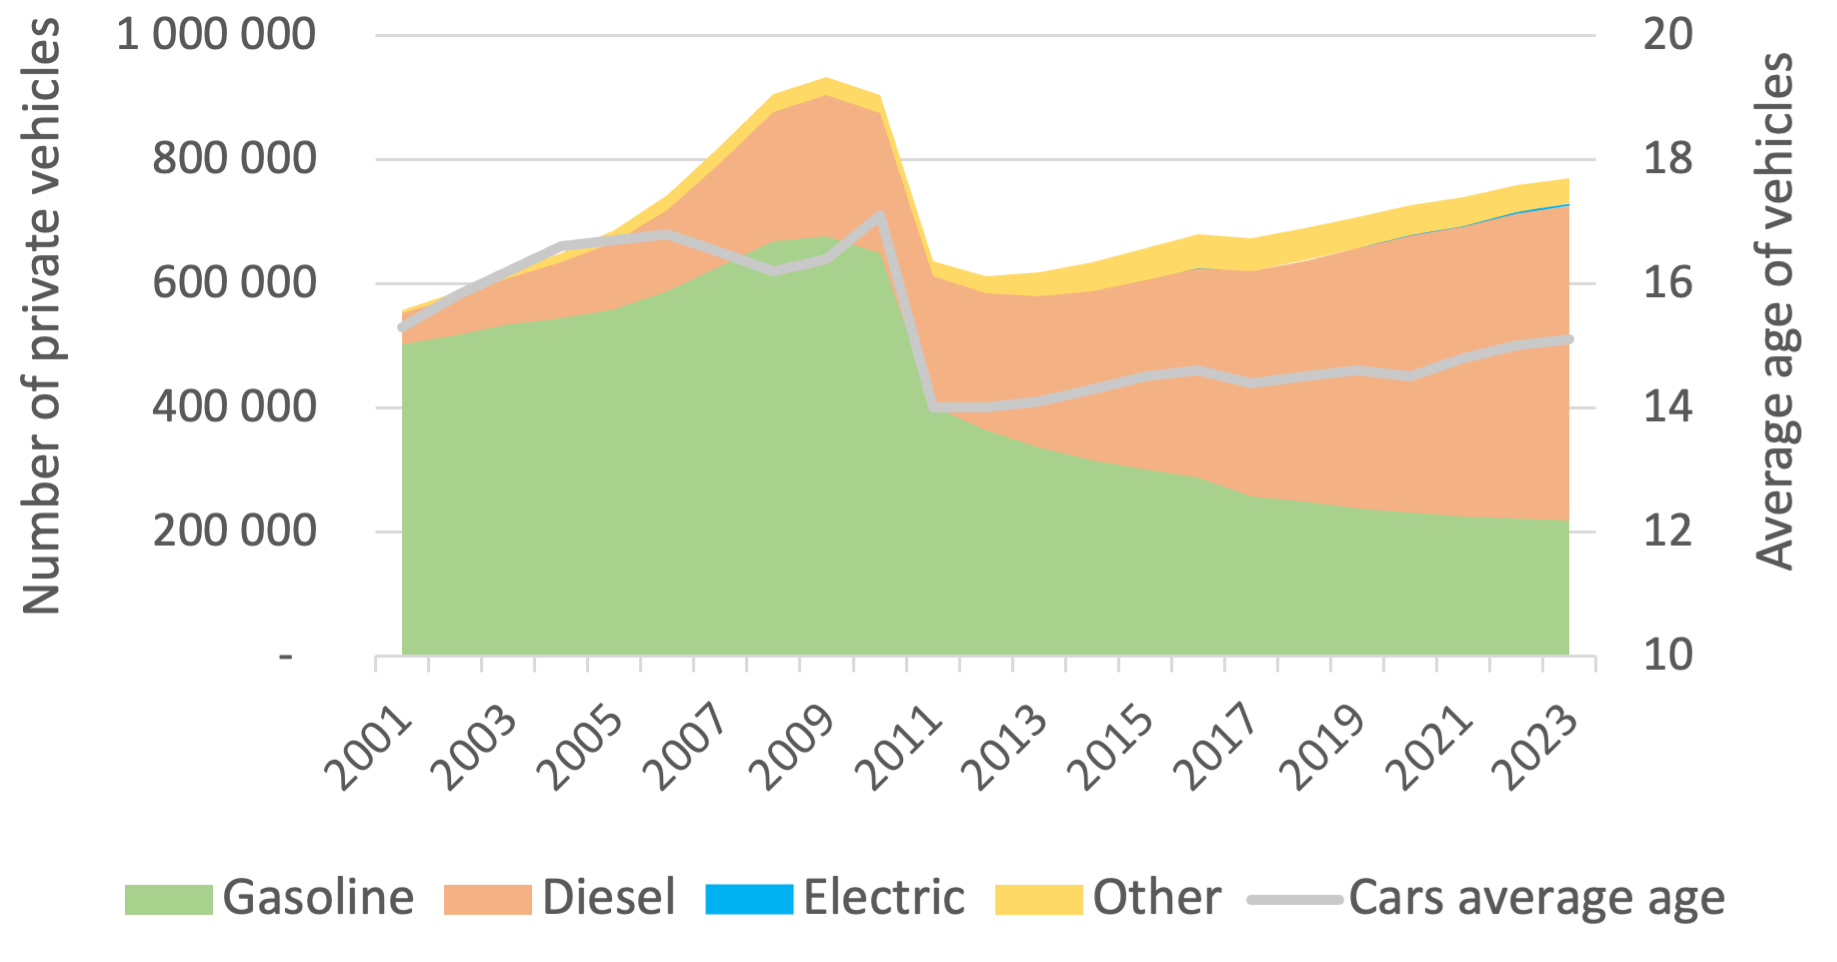
Source: The Central Statistical Bureau of Latvia, Latvia’s Road Traffic Safety Directorate.
Figure 3 also shows that Latvia’s average vehicle age increased from 14 years in 2011 to 15.1 years in 2023. This is similar to the overall EU trend, although EU cars are around 12 years old, on average. This means that, in Latvia, the average car in 2011 and 2023 were manufactured in 1997 and 2008, respectively. One would expect that engines from 2008 have better technical characteristics compared to those from 1997. Recent economic research show that prior to 2005, improvements in fuel efficiency for new cars sold in the EU was largely counterbalanced by increased engine power, enhanced consumer amenities and improved acceleration performance (Hu and Chen, 2016). I.e., cars became heavier, larger, and more powerful, leading to higher fuel consumption. However, after 2005, cars’ net fuel efficiency started to improve. As sold cars in Latvia are typically 10-12 year old vehicles from Western European countries, Latvia will gradually absorb a more fuel-efficient vehicle fleet.
Conclusion
The increase of purchasing power, a shift to more efficient fuel types and improvements in engine efficiency have all contributed to a reduction of the overall real cost of transportation over time in Latvia. The recent rise in fuel prices to historically high levels is thus less concerning than it initially appears. Moreover, a growing share of cars will not be directly affected by fuel price fluctuations in the future. Modern electric vehicles constitute only 0.5 percent of all cars in Latvia today, however, they so far account for 10 percent of all newly registered cars in 2023, with an upward sloping trend.
Still, politicians are often concerned about the unequal effects of fuel price fluctuations on individuals. Different car owners experience varied effects, especially when considering factors like income and location, influencing transportation supply and demand.
First, Latvia ranks as one of the EU’s least motorized countries, only ahead of Romania, with 404 cars per 1000 inhabitants in 2021. This lower rate of vehicle ownership is likely influenced by the country’s relatively low GDP per capita (73 percent of the EU average in 2022) and a high population concentration in its capital city, Riga (32 of the population lives in Riga city and 46 percent in the Riga metropolitcan area). In Riga, a developed public transport system reduces the necessity for personal vehicles. Conversely, areas with limited public transport options, such as rural and smaller urban areas, exhibit a higher demand for personal transportation as there are no substitution options and the average distance travelled is higher than in urban areas. Thus, car owners in these areas tend to be more susceptible to the impact of fuel price volatility.
Second, Latvia has a high Gini coefficient compared to other EU countries, indicating significant income inequality (note that the Gini coefficient measures income inequality within a population, with 0 representing perfect equality and 1 indicating maximum inequality. In 2022, the EU average was 29.6 while Latvia’s Gini coefficient was 34.3, the third highest in the EU). With disparities in purchasing power, price hikes tend to disproportionately burden those with lower incomes, making fuel more costly relative to their monthly wages.
These income and location factors suggest that inhabitants in rural areas are likely the most affected by recent price hikes. Distributional effects across geography (rural vs urban) are often neglected in public discourse, as the income dimension is more visible. But both geography and income factors should be accounted for in a prioritized state support, should such be deemed necessary.
Authors
Julius Andersson (SITE), Celina Tippman (MISUM), Sergejs Gubins (BICEPS), Tatia Khidasheli (ISET-PI), Giorgi Shavreshiani (ISET-PI), Salome Gelashvili (ISET-PI) & Erekle Shubitidze (ISET-PI)
References
Disclaimer: Opinions expressed in events, policy briefs, working papers and other publications are those of the authors and/or speakers; they do not necessarily reflect those of SITE, the FREE Network and its research institutes.
Photo: FXQuadro, Shutterstock